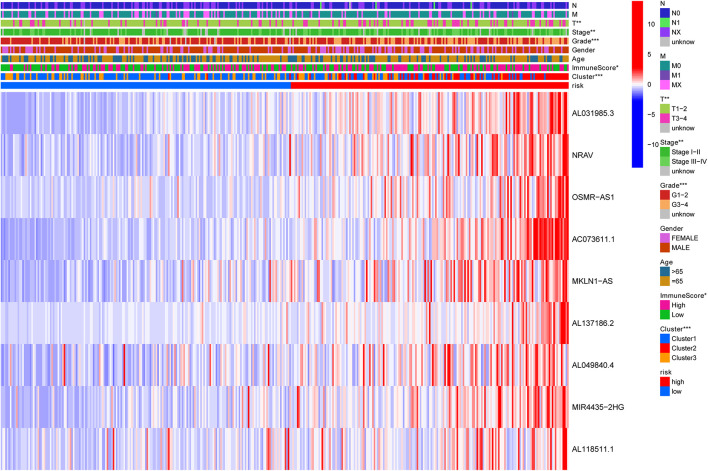
FIGURE 7.
Heatmap to show the connection between clinical pathology, clusters, and risk scores. The results indicated that the expression of the nine lncRNAs in the high-risk group was significantly higher than that in the low-risk group, and this trend was more obvious in cluster 2. N, lymph node; M, metastasis; T, tumor.

