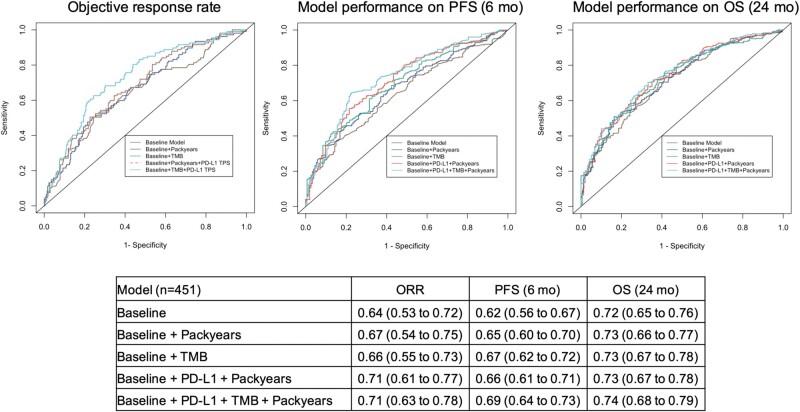
Figure 2.
Model performance on objective response rate (ORR), progression-free survival (PFS) at 6 months, and overall survival (OS) at 24 months. Predictive logistic and Cox proportional hazards regression models were constructed and validated in the patients with complete information (n = 451) using 10-fold cross-validation. Receiver operating characteristics (ROC) area under the curve (AUC) illustrates the model performance on ORR, and time-dependent AUC on PFS at 6 months and on OS at 24 months using different predictors. The baseline model incorporated age at treatment initiation, gender, histology, Eastern Cooperative Oncology Group Performance Status, and lines of treatment, and they were consistently incorporated in all of the models. The table below the graphs displays the AUCs with 95% confidence intervals shown within parentheses. These 95% confidence intervals were calculated from 500 bootstrapping. PD-L1 TPS = programmed cell death ligand-1 tumor proportion score; TMB = tumor mutation burden.

