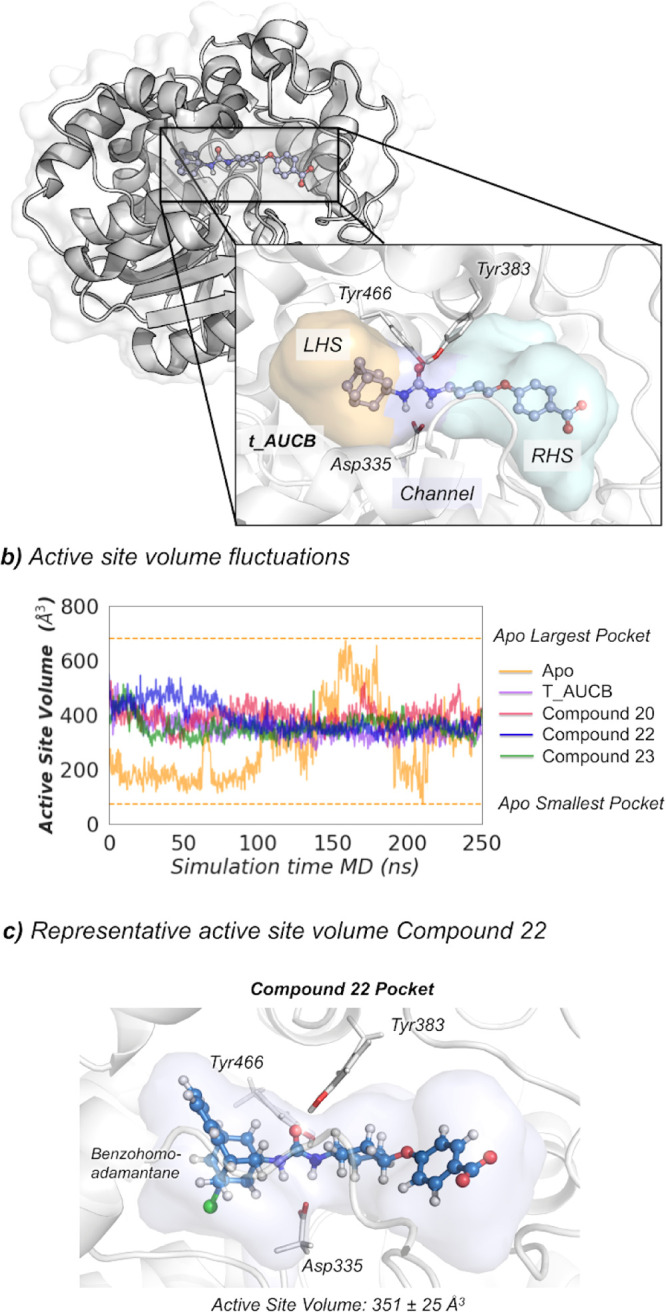
Figure 4.

(a) Representation of the sEH structure (PDB: 5AM3), active site catalytic residues (nucleophilic Asp335, Tyr383, Tyr466), and t-AUCB inhibitor. The LHS pocket is colored in orange, the RHS pocket is colored in cyan, and the central channel in purple. (b) Plot of the fluctuations of the active site volume for the apo state (orange line, 290 ± 133 Å3), t-AUCB (purple line, 335 ± 33 Å3), compound 20 (red line, 396 ± 37 Å3), compound 22 (blue line, 351 ± 25 Å3), and compound 23 bound (green line, 356 ± 32 Å3) along a representative 250 ns MD simulation trajectory. The average volumes are calculated for the last 150 ns of the MD simulation. (c) Representative sEH structure with the active site volume obtained from MD simulations of compound 22.
