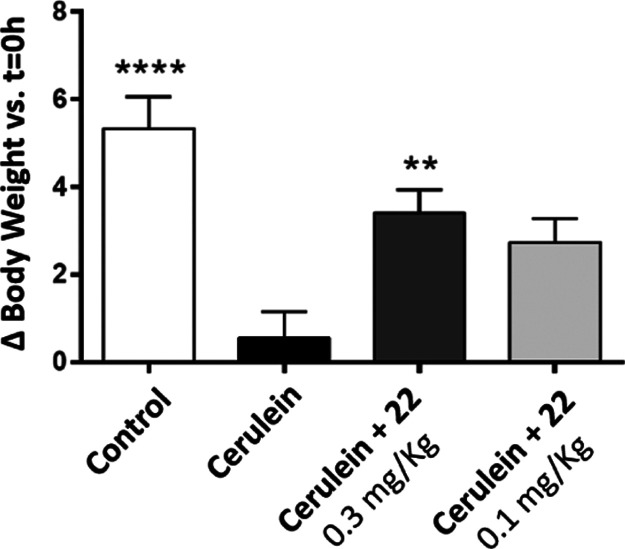
Figure 7.
Percentage of body weight change at the end of the study vs t = 0 h. Effect of 12 consecutive administrations of cerulein (50 μg/kg, IP) and treatment with 22 (single dose, 0.3 or 0.1 mg/kg, IP) on C57BL/6 male mice body weight. Results are expressed as mean ± SEM (n = 3–9). *p < 0.05, **p < 0.01, ****p < 0.0001 vs Cerulein group (ANOVA-one way).

