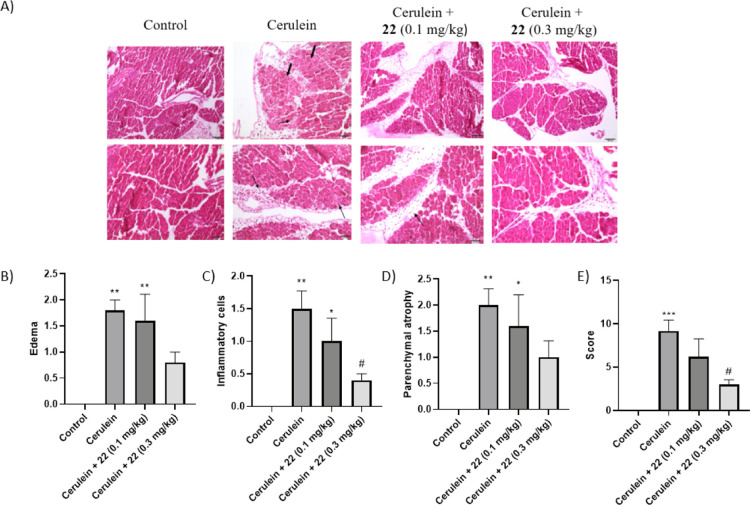
Figure 8.
Results of the histologic analysis of pancreas from mice treated with vehicle (control), cerulein, and cerulein plus either 0.1 or 0.3 mg/kg of compound 22. (A) Representative H&E-stained sections of the pancreas from the in vivo efficacy study. Arrows indicate inflammatory cells and edema. Bold arrows indicate intracellular vacuoles. (B–E) Histologic scoring of pancreatic tissues. (B), edema. (C), inflammatory cells (mononuclear and polymorphonuclear). (D), parenchymal atrophy. (E), total scoring (pancreatic parenchymal atrophy, vacuolar degeneration of cells, edema, hemorrhage, mononuclear inflammatory cells, mononuclear inflammatory cells, polimorfonuclear inflammatory cells and necrosis). *p < 0.05, **p < 0.01 and ***p < 0.001 vs control. #p < 0.05 vs cerulein.

