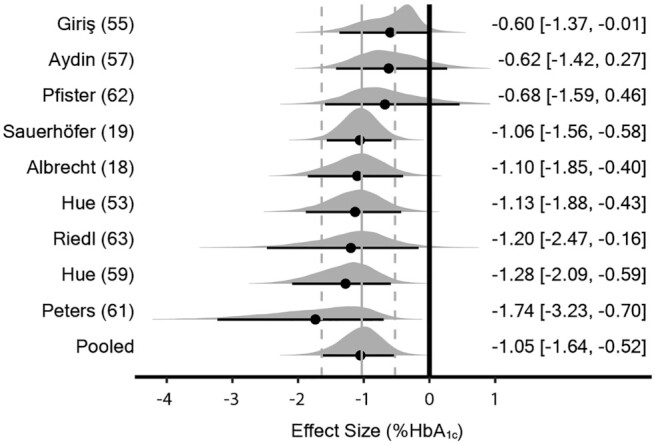
FIGURE 5.

Bayesian forest plot of meta-analysis for HbA1c in rodent studies. Each interval represents posterior “shrunken” estimates based on the random-effects model fitting and borrowing information across studies to reduce uncertainty. Circles represent the median value along with 90% credible intervals. Negative values show a reduction in HbA1c in the intervention group compared with the control group. This analysis included 260 rodents (127 intervention/133 control). All studies supplemented with carnosine. HbA1c (HbA1c), glycated hemoglobin.
