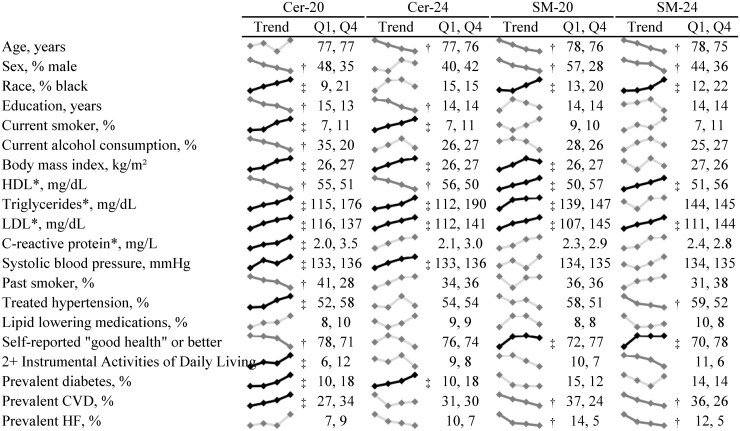
Fig. 1.
Baseline characteristics of study participants according to quartiles of select ceramide and sphingomyelin species. The * denotes variables only measured at the exam in 1992–1993. To convert HDL and LDL cholesterol concentrations to mmol/L multiply by 0.0259. To convert triglycerides concentration to mmol/L, multiply by 0.0113. † indicates a significant inverse association and ‡ indicates a significant positive association based on a Bonferroni-corrected p-value of 0.05/20=0.0025 (based on 20 baseline characteristics of interest).

