
Figure 7.
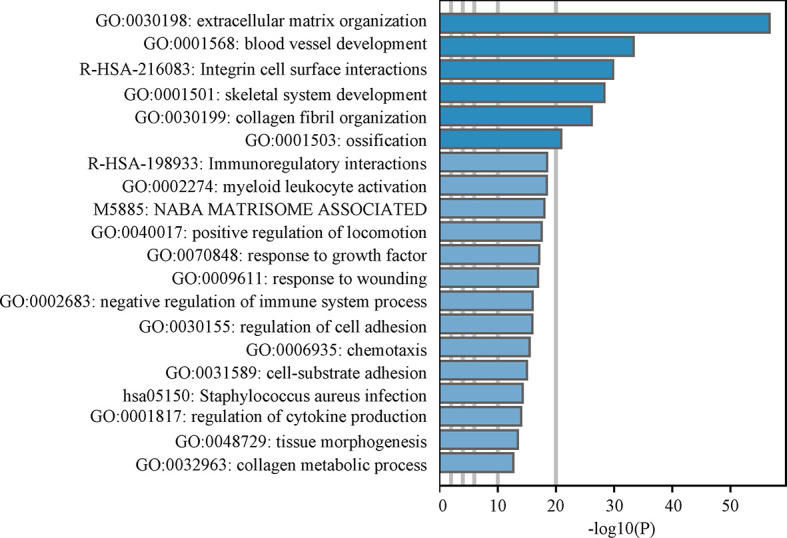
Enrichment analysis. The bar chart is the results of Metascape enrichment analysis. Larger the-log10 (P) implies greater significance.
Official websites use .gov
A
.gov website belongs to an official
government organization in the United States.
Secure .gov websites use HTTPS
A lock (
) or https:// means you've safely
connected to the .gov website. Share sensitive
information only on official, secure websites.
Enrichment analysis. The bar chart is the results of Metascape enrichment analysis. Larger the-log10 (P) implies greater significance.