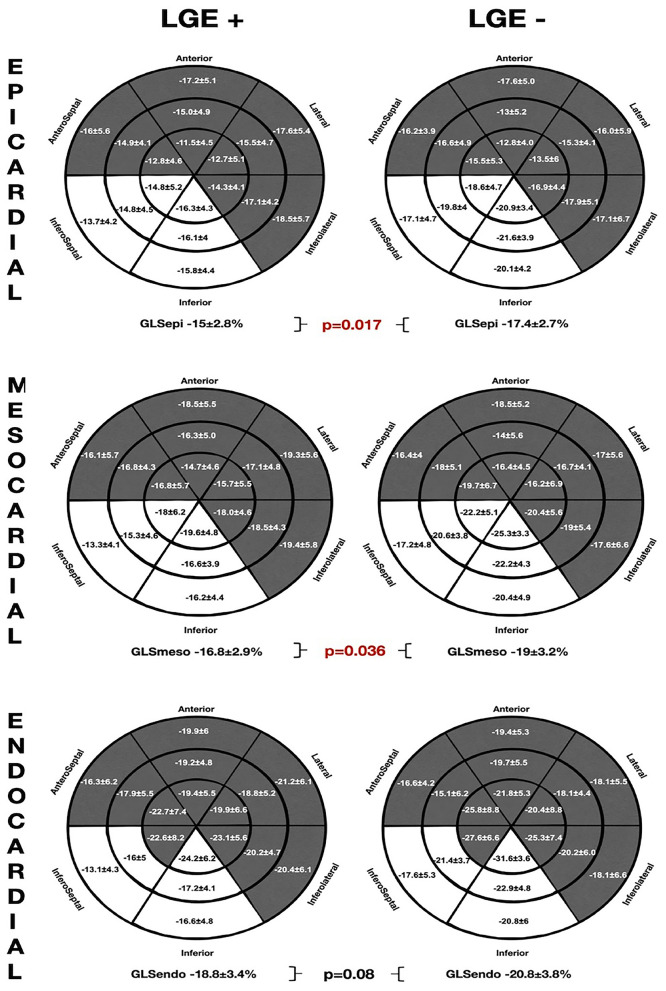
Figure 4.
The comparative global and regional layer-specific GLS analysis global between the LGE (+) and LGE (–) groups represented in the LV 18-segment models according to each myocardial layer. White areas remark significant differences in regional longitudinal strain between the groups. GLS, global longitudinal strain; LGE, late gadolinium enhancement.

