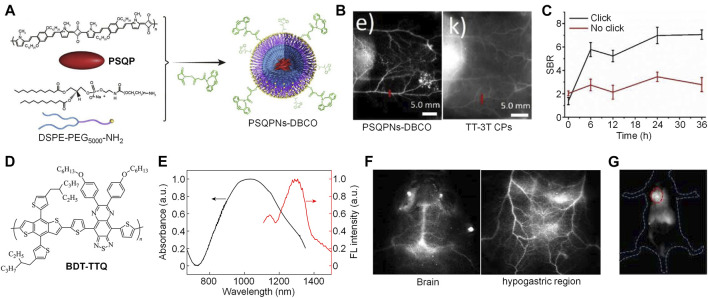
FIGURE 2.
(A) Schematic illustration of preparation of PSQPNs-DBCO. (B) NIR-II fluorescence imaging of blood vessels by PSQPNs-DBCO and TT-3T CPs. (C) Signal-to-background ratio (SBR) of tumor tissue of mice with different treatments. (D) Chemical structure of BDT-TTQ. (E) Absorption and emission spectra of BDT-TTQ NPs in water. (F) NIR-II fluorescence imaging of brain and hypogastric region of BDT-TTQ NPs-injected mice. (G) NIR-II fluorescence imaging of tumor after i.v. injection of BDT-TTQ NPs for 12 h. The red circle indicates the location of tumor. Adapted from ref. 16 and 24. Copyright© 2020 Elsevier and 2020 Chinese Chemical Society.

