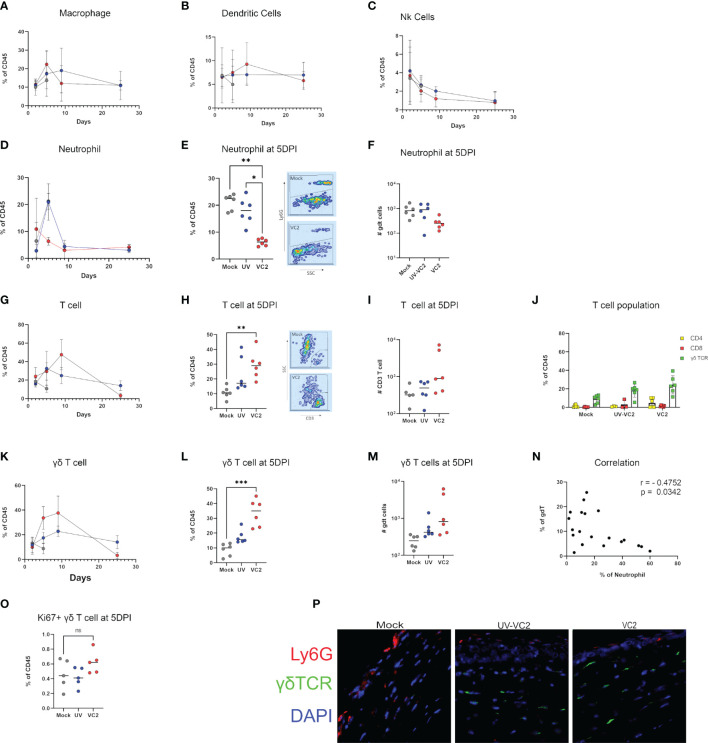
Figure 3.
Phenotype of cellular infiltrates in ocular tissues following viral challenge. Flow cytometric analysis for cellular infiltration for: (A) Macrophage. (B) Dendritic cells. (C) NK cells over time. (D) Percentage of neutrophil accumulation over time. (E, F) Percentage and absolute count of neutrophils at 5DPI. (G) Percentage of T cell accumulation over time. (H, I) Percentage and absolute count of T cells. (J) Phenotype of T cells in individual groups. γδT cell accumulation over time (K), percentage (L) and absolute count (M) at 5DPI. (N) Spearman's rank correlation between γδT cell and neutrophil accumulation among all groups. (O) Ki67+ γδT cell in cornea. (P) IFM for the presence of neutrophils and γδT using OCT section. **<P=0.005, ***<P=0.001 using One-Way ANOVA, n=6/group/timepoint.

