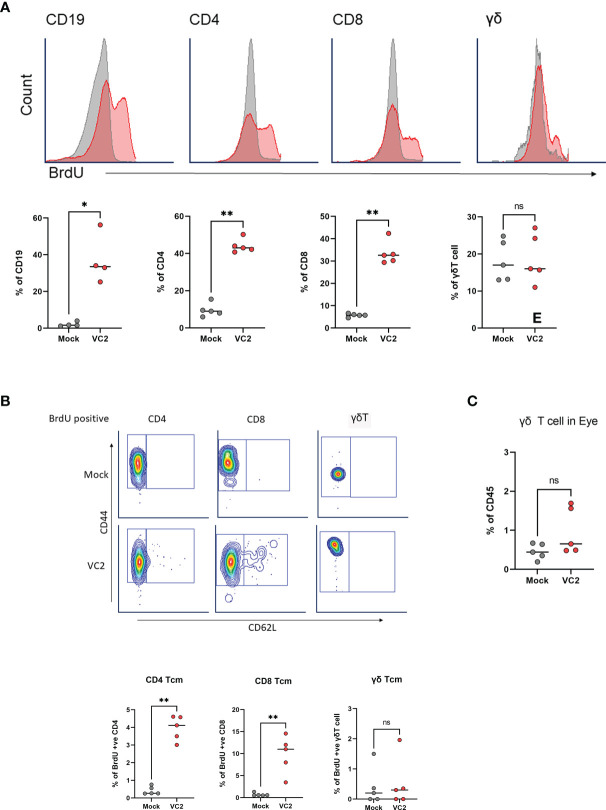
Figure 6.
Analysis of antigen-specific memory T cell expansion in LN at 5DPI. (A) Representative histogram (top panel) and percentage of BrdU incorporation in CD19, CD4, CD8 and γδT cells in mLN cells using flow cytometry (bottom panel). (B) Representative gating (Top panel) and percentage of BrdU-positive TCM in CD4, CD8 and γδT cell populations. (C) Percentage of BrdU-positive γδT cell in the eye following infection. *<P=0.05, **<P=0.005 using Mann-Whitney test, n=5/group. ns, Non-Significant.

