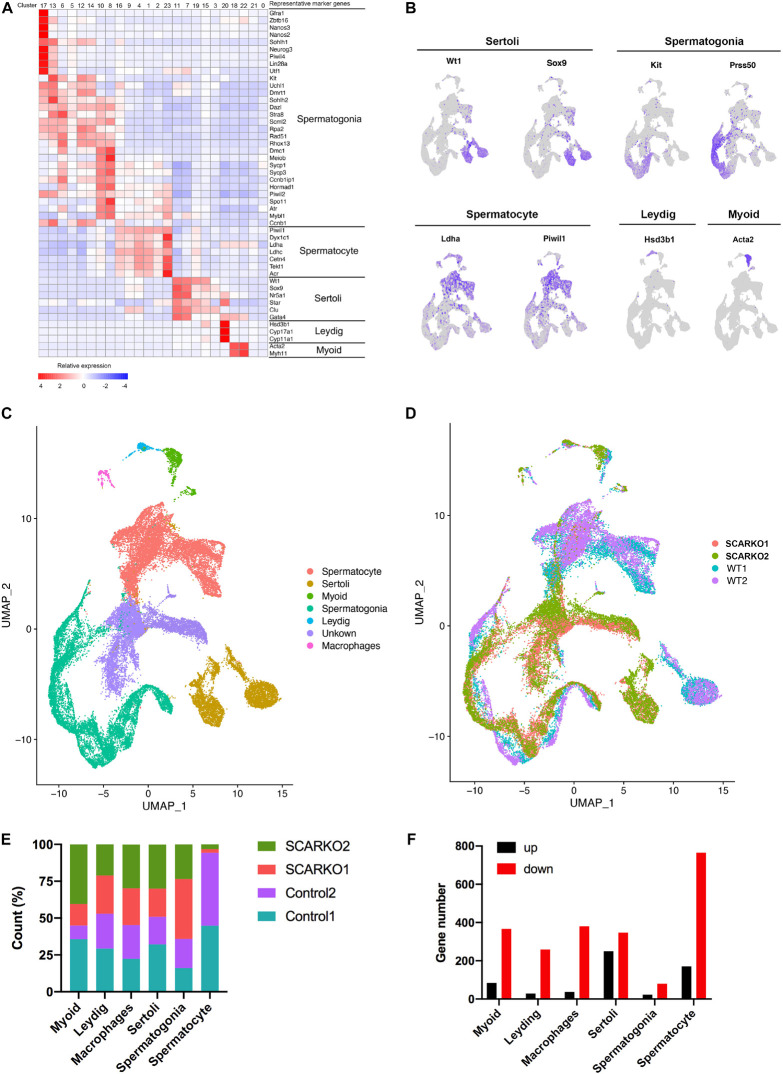
FIGURE 2.
ScRNA-seq profiles of P20 WT and SCARKO testicular cells and cell type identification. (A) Heatmap of differentially expressed genes (DEGs) from the five major cell types. Top: cell cluster; right: major cell types and representative enriched marker genes for each cell type. (B) Representative markers for each cell type. (C,D) tSNE and clustering analysis of combined single-cell transcriptome data from P20 WT and SCARKO testicular cells. Each dot represents a single-cell and cell clusters are distinguished by colors. (E) The percentage of cell numbers in each cluster in P20 WT and SCARKO testicular cells. (F) The number of DEGs (up and down-regulated) in each cluster in SCARKO testicular cells.

