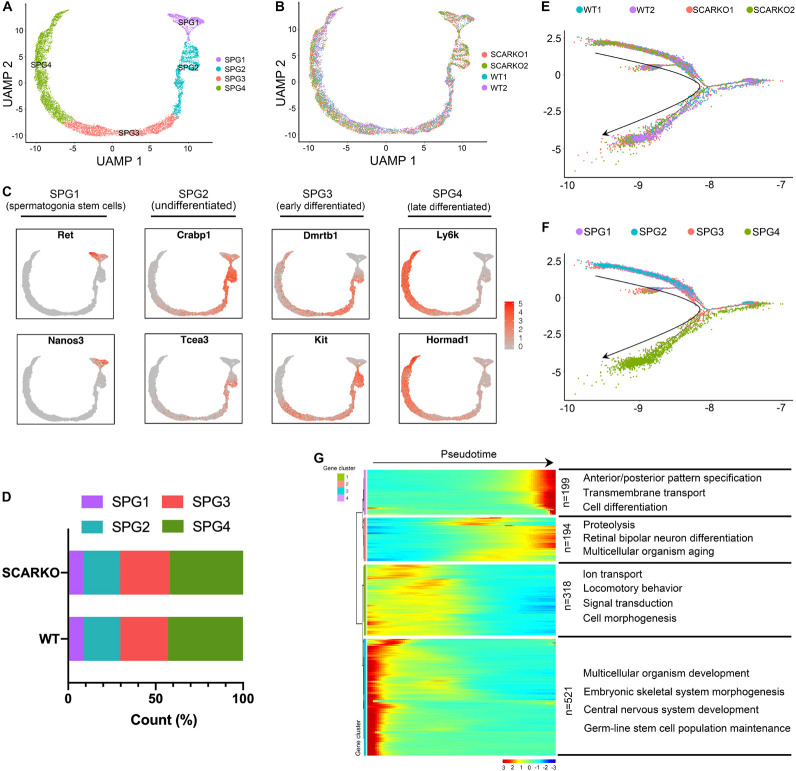
FIGURE 5.
Identification of spermatogonia clusters in WT and SCARKO mice. (A,B) UMAP plot of spermatogonia from P20 WT and SCARKO mice. (A) spermatogonia clusters; (B) sample source. (C) Gene expression patterns of selected marker genes corresponding to each cellular state on the UMAP plots. (D) The percentage of cell numbers in each state in P20 WT and SCARKO spermatogonia. (E,F) Monocle pseudotime trajectory analysis of the spermatogonia clusters. spermatogonia clusters; (F) segregated by sample source. Arrow indicates the inferred developmental direction from the analysis shown in (A). (G) Heatmap of DEGs from different spermatogonia subsets following the trajectory timeline shown in (E). Top: pseudotime directions; right: the number of DEGs and the representative biological processes.

