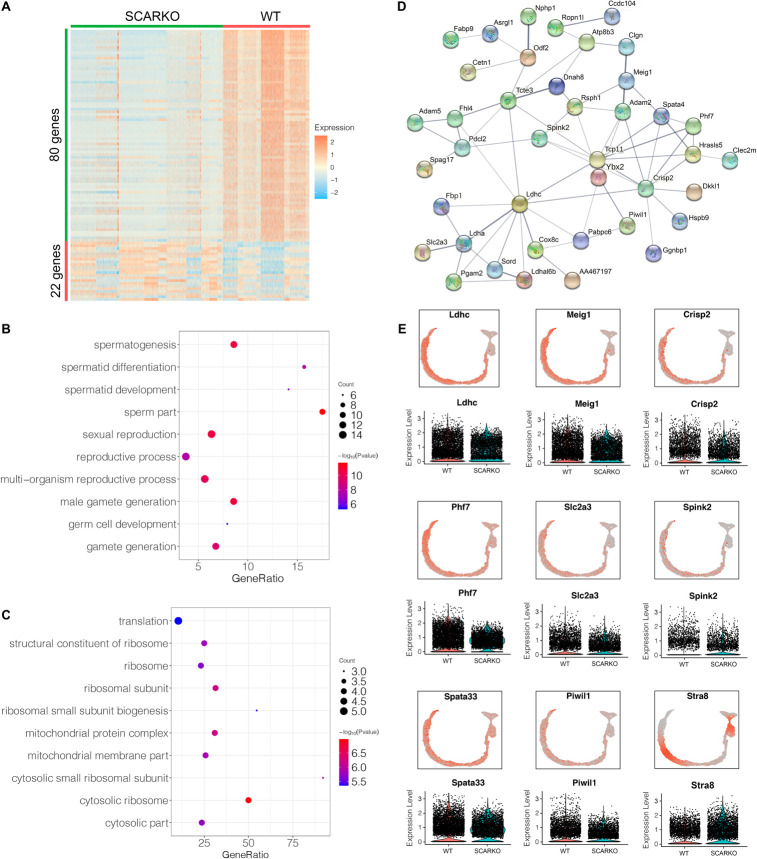
FIGURE 6.
Identification of DEGs in spermatogonia from WT and SCARKO mice. (A) Heatmap of DEGs between WT and SCARKO Sertoli cells. (B,C) GO term analysis of up-regulated (B) and down-regulated (C) genes in SCs of SCARKO mice. (D) Gene regulatory networks of DEGs shown in (A). (E) Violin plot showing the expression levels of DEGs in WT and SCARKO spermatogonia.

