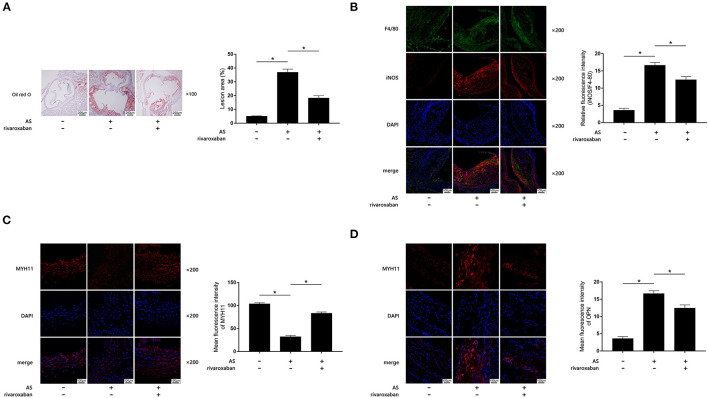
Figure 1.
(A) Atherosclerotic plaques are shown by oil red O stain of aorta root of ApoE−/− mice, which are demonstrated on the left panel. Columns on the right side indicate relative plaque area in control, atherosclerosis (AS) mice, and AS mice treated with rivaroxaban. (B) Immunofluorescence stains of F4/80, iNOS, DAPI, and their merged images are demonstrated. Columns indicate the relative fluorescence intensity of iNOS (normalized to F4/80) in aorta root harvested from control, AS mice, and AS mice treated with rivaroxaban. (C) Immunofluorescence stains of MYH11, DAPI, and their merged images are demonstrated. Columns indicate the mean fluorescence intensity of MYH11 in aorta root harvested from control, AS mice, and AS mice treated with rivaroxaban. (D) Immunofluorescence stains of OPN, DAPI, and their merged images are demonstrated. Columns indicate the mean fluorescence intensity of OPN in aorta root harvested from control, AS mice, and AS mice treated with rivaroxaban (data were presented as mean ± SD, n = 6, Mann–Whitney U-test was used, *P < 0.05).

