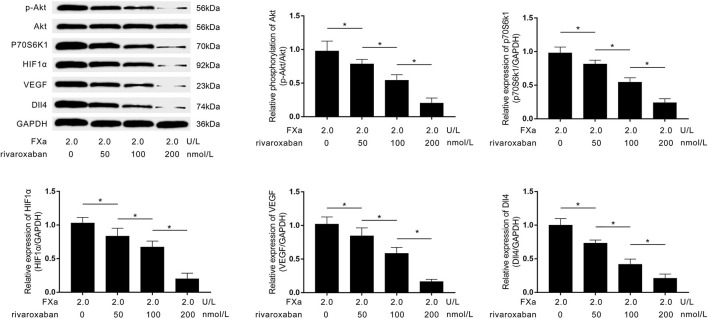
Figure 6.
Immunoblots of p-Akt, Akt, p70S6K1, HIF1α, VEGF, Dll4, and GAPDH are demonstrated. Columns indicate the relative expression levels of HIF1α, VEGF, and Dll4, as well as the relative phosphorylation level of Akt in macrophages exposed to FXa at 2.0 U/L and treated with rivaroxaban at concentrations of 0, 50, 100, and 200 mmol/L (data were presented as mean ± SD, n = 6, Student's t-test and ANOVA, *P < 0.05).

