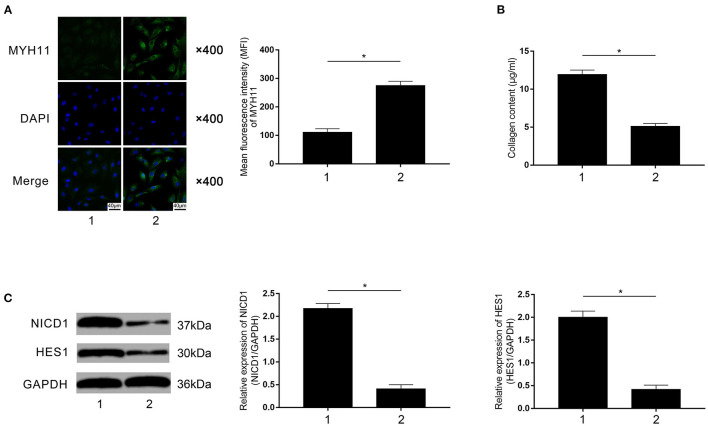
Figure 7.
(A) Immunofluorescence stains of MYH11, DAPI, and their merged images are demonstrated. Columns indicate the mean fluorescence intensity of MYH11 in VSMCs co-cultured with rivaroxaban-treated or un-treated macrophages exposed to FXa in the contact co-culturing model. (B) Columns indicate the measured collagen content of VSMCs co-cultured with rivaroxaban-treated or un-treated macrophages exposed to FXa in the contact co-culturing model. (C) Immunoblots of NICD1, HES1, and GAPDH are demonstrated. Columns indicate the relative expression levels of NICD1 and HES1 in VSMCs co-cultured with rivaroxaban-treated or un-treated macrophages exposed to FXa in the contact co-culturing model (data were presented as mean ± SD, n = 6, Student's t-test and ANOVA, *P < 0.05).

