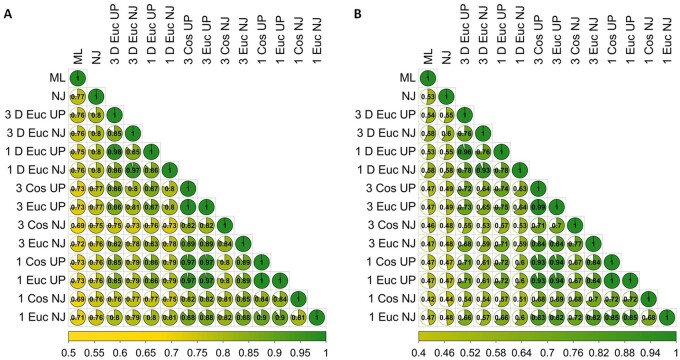
Figure 1.
(A) Proportion of common nodes (nodes with the exact same list of terminal taxa) depicted in the dendrogram comparisons from all methods used to resolve the relationships among spike protein receptor-binding domains. (B) Inverse Normalized Robinson–Foulds Metric for the dendrogram comparisons of all methods used to resolve the relationships among spike protein receptor-binding domains. MW and HP were used as the physicochemical properties for all methods as described in the methods section. The first two methods shown were standard alignment-based ML and alignment-based NJ analyses of the amino acid sequences. The remaining 12 analyses shown used waveforms as described in the Methods section. Among those methods, the first part of the label for each method indicates whether a three-peak or single-peak waveform was encoded. If present, the ‘D’ following the peak designation indicates that DTW was used. The next part indicates the distance measure used (Cos = cosine or Euc = Euclidean). The final part indicates the dendrogram reconstruction method‘UP’ indicates UPGMA.

