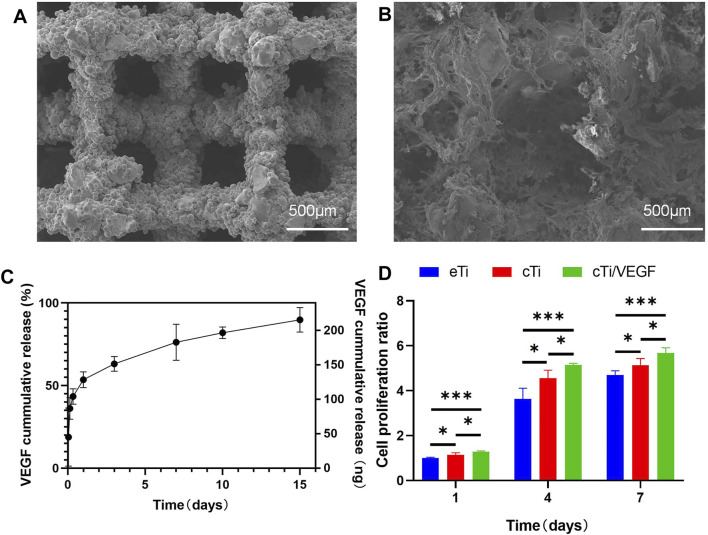
FIGURE 1.
Microscopic characterization of eTi (A) and cTi (B), using SEM scanning images (C) VEGF release curve in vitro within 15 days (D) Analysis of the HUVECs proliferation in each group, using the eTi of the first day as a reference (n = 3, *indicates significant differences between groups, *p < 0.05; **p < 0.01; ***p < 0.001).

