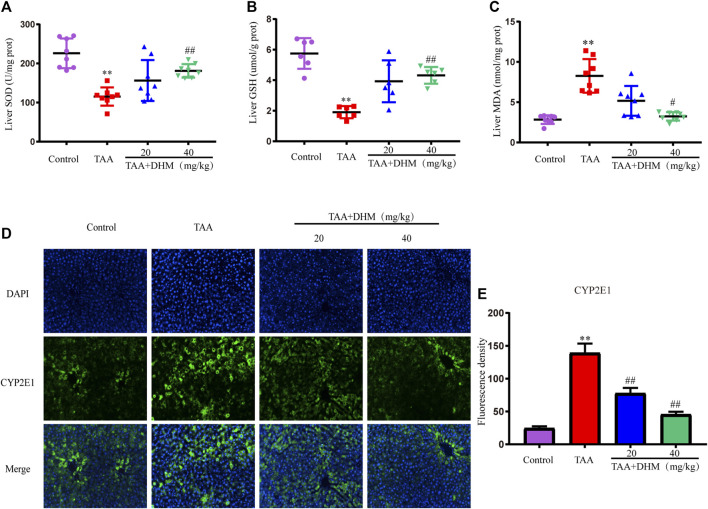
FIGURE 2.
DHM attenuates TAA-induced oxidative stress and hepatotoxicity. The hepatic levels of SOD (E), GSH (F) and MDA (G) in TAA-induced liver fibrosis (n = 6–8); The protein expression levels of CYP2E1 (E) and Fluorescence density (F); Data was expressed as the mean ± SD. The differences between groups were analyzed by two tailed T-test or one-way analysis of variance (ANOVA). **p < 0.01, *p < 0.05 versus control group; ##p < 0.01, #p < 0.05 versus TAA group.

