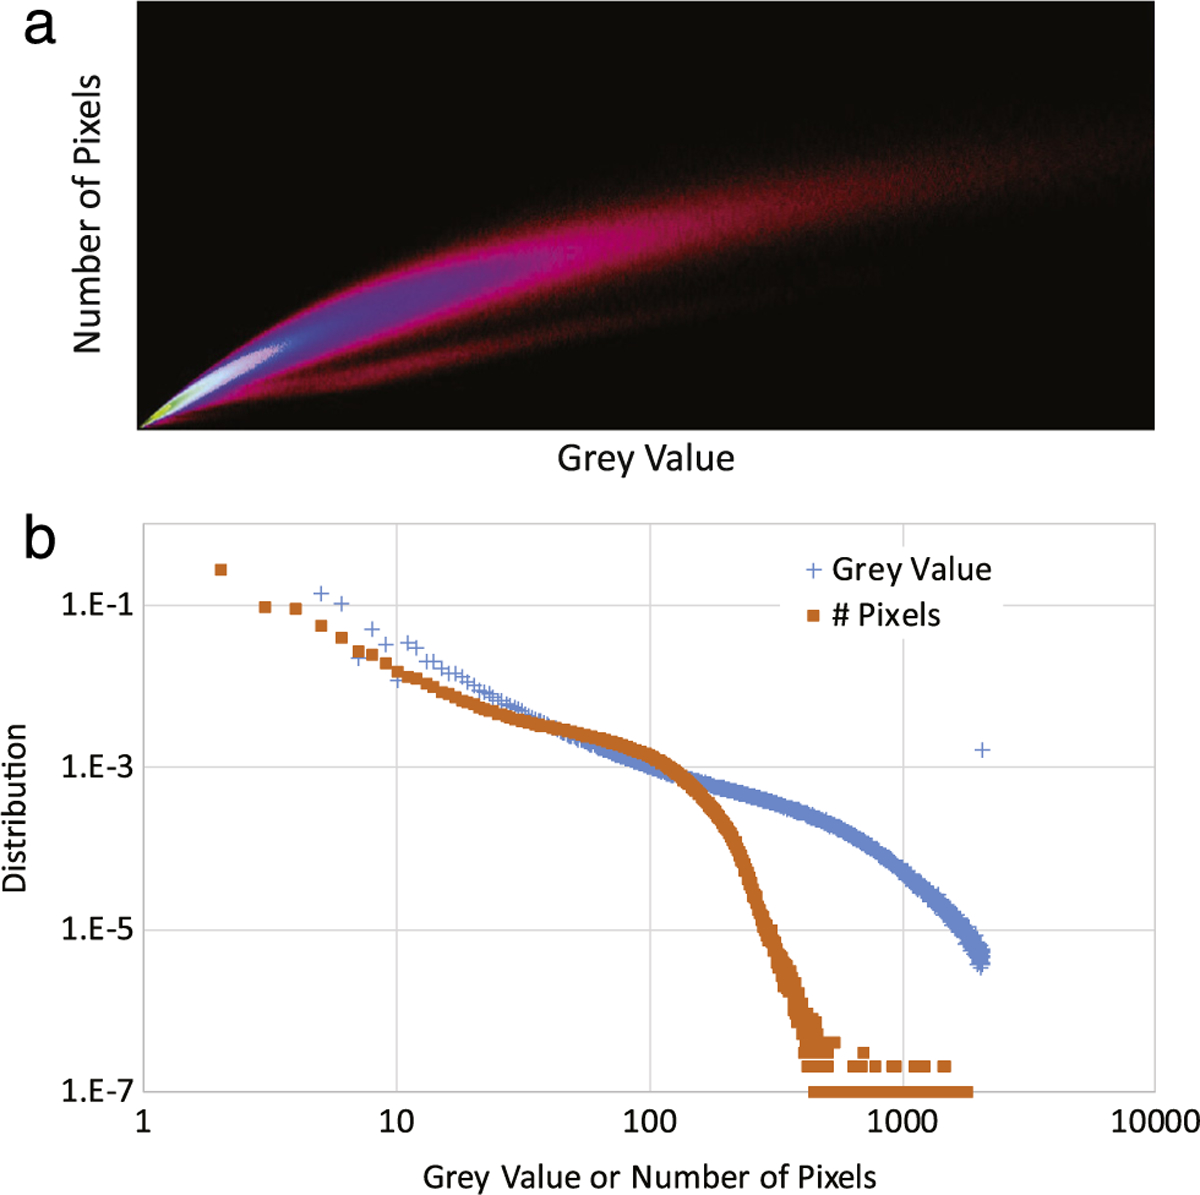
Fig. 3.

2D histogram of events in terms of number of pixels and total gray values in a scintillation event. The image is the log of the distribution. Clearly visible are two branches of events, likely corresponding to the two populations of electrons stemming from neutron capture in Gd-157 and Gd-155. In (a) the lower, less populated branch corresponds to lower energy electrons stemming from both isotopes.
