
Fig. 4.
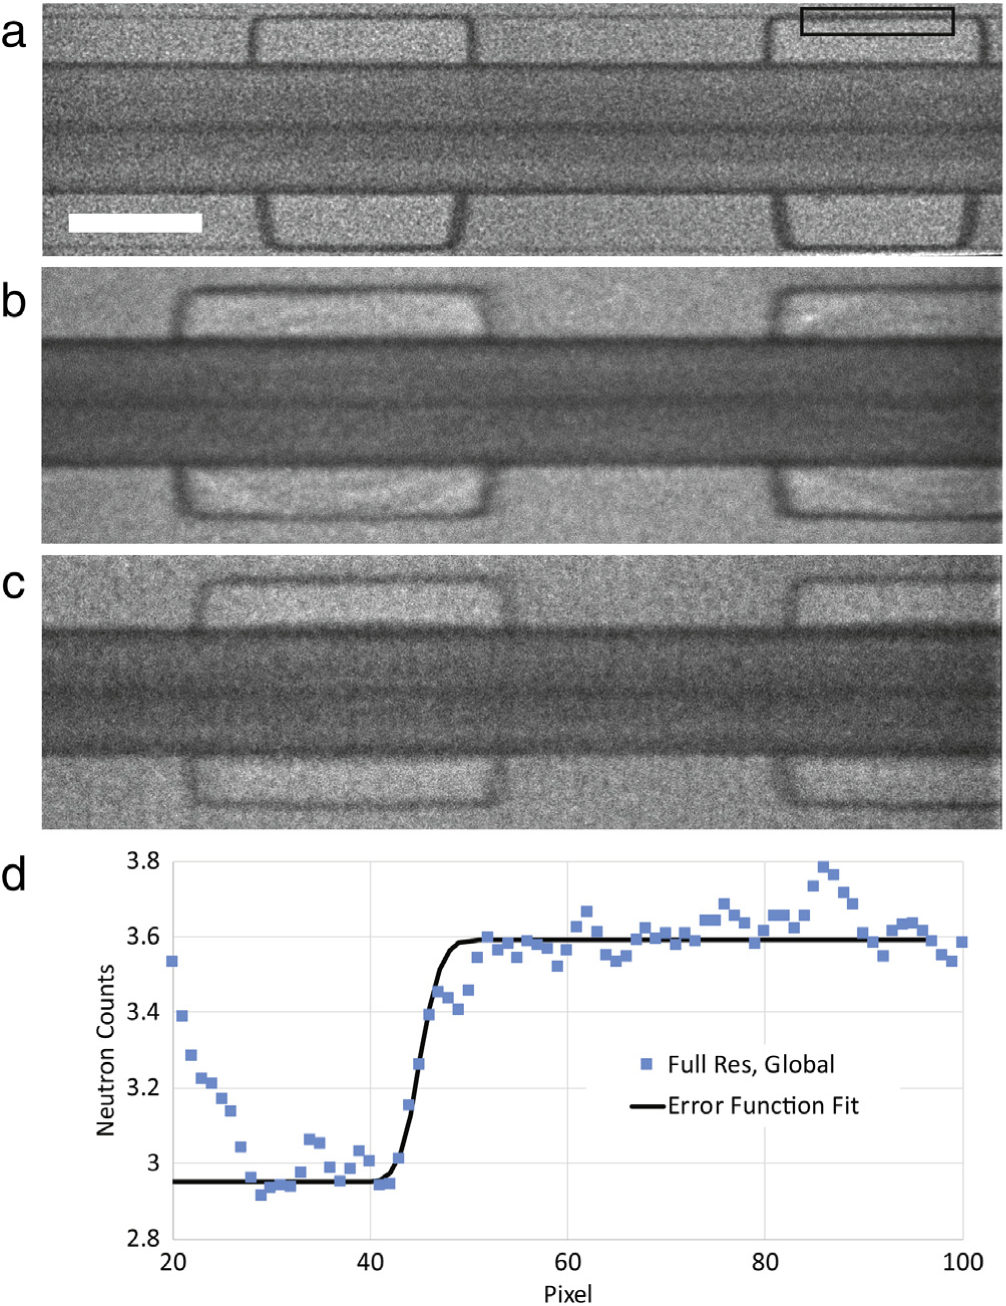
Image quality comparison between three acquisition strategies. (a) Full pixel depth, global shutter 80,000 frames, the length of the white scale bar is 0.5 mm, (b) 2×2 pixel binning, global shutter 400,000 frames, (c) 2×2 pixel binning, rolling shutter, 400,000 frames. Different fuel cell test sections were used for the three images, (d) error function fit to the intensity averaged in the vertical direction in the box shown in (a), the standard deviation of the fit is 1.7 pixels, the pixel pitch is 0.8 μm, the resolution is 1.98 μm.