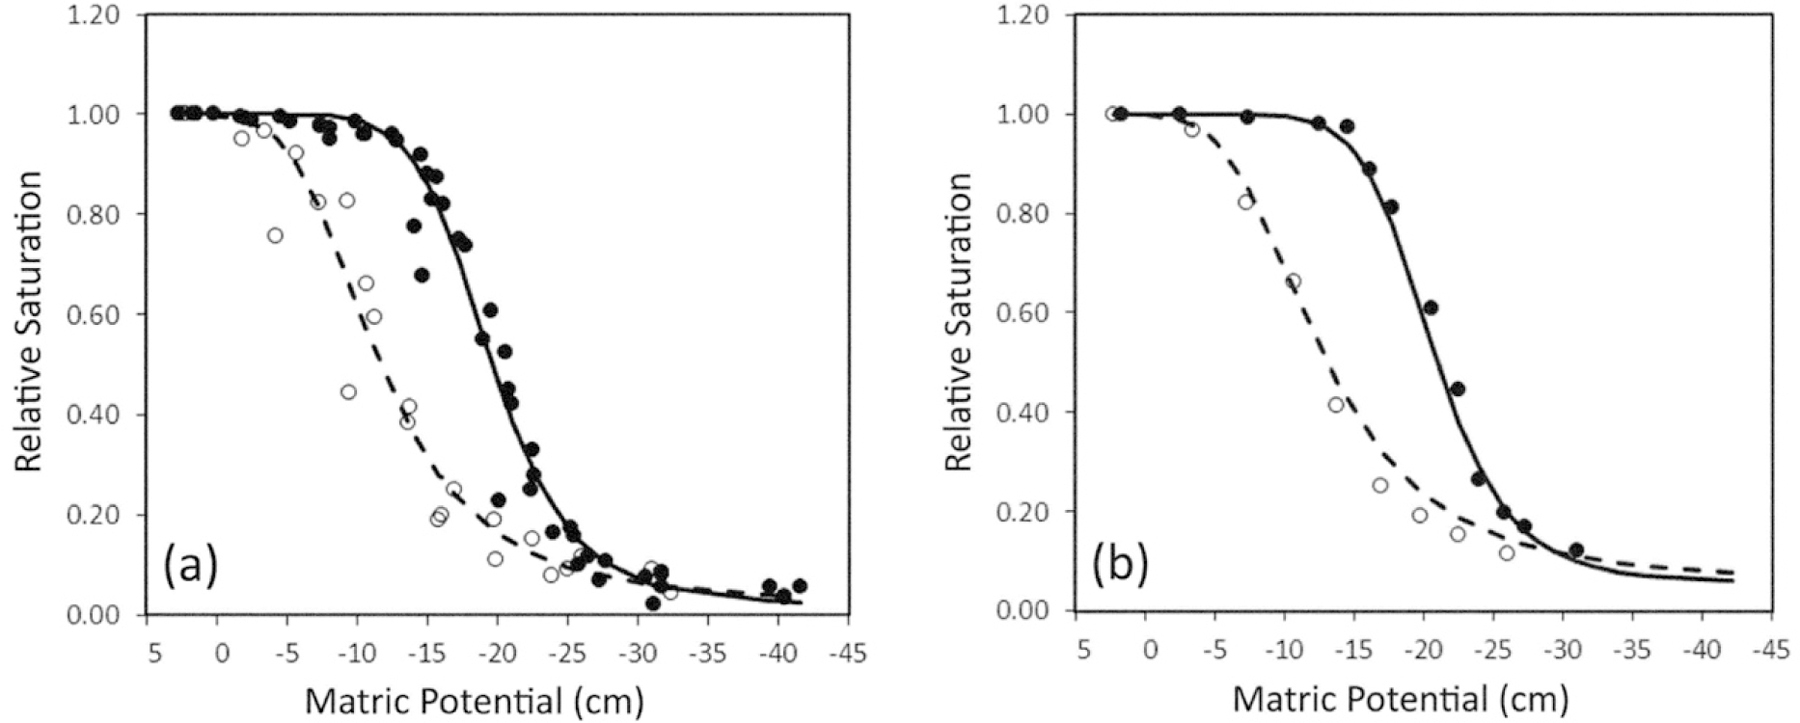
Fig. 6.

Measured average relative saturation values (closed circle: drying, open circle: wetting) and fitted van Genuchten (1980) functions (solid line: drying, dashed line: wetting) for (a) the hanging water column experiments (data for all replicates pooled) and (b) the unreplicated neutron imaging experiments. The 95% confidence intervals for individual points are not shown because they were smaller (≤0.032) than the symbols used.
