Figure 1 .

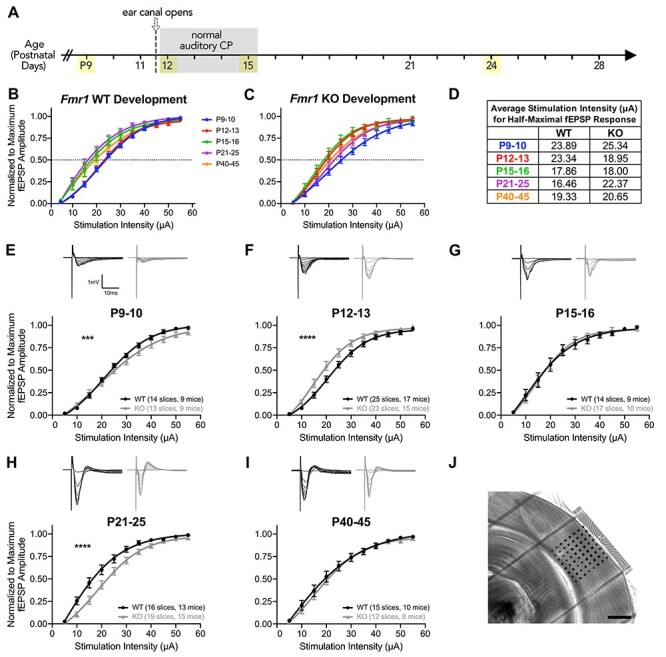
Fmr1 KO mice exhibit dynamic changes in excitability in L4 to L2/3 basal synaptic transmission during auditory cortex development. I–O curves of stimulation intensity to fEPSP amplitude, normalized to maximum amplitude, and fit with sigmoidal curves. (A) The timeline of approximate auditory postnatal maturation in mice with ages analyzed for experiments highlighted in yellow. (B–C) The overlay of I–O curves for WT and KO mice to evaluate developmental shifts in excitability. (D) Average stimulation intensities for half-maximal fEPSP response estimated from sigmoidal curve fits in (B) and (C). (E–I) Top: representative fEPSP traces in L2/3 extracellular recordings from L4 stimulation. Bottom: the comparison of sigmoidal curve fits for I–O curves at each age between WT and Fmr1 KO mice. (F) Fmr1 KO mice are significantly more excitable at P12–13 and (H) significantly less excitable at P21–24. (J) Representative DIC image of coronal slice with MEA overlaid on the auditory cortex. Scale bar: 600 μm. ***P < 0.001, ****P < 0.0001.
