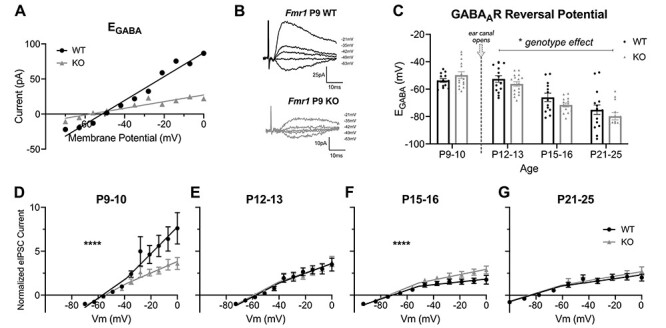
Figure 7 .

Fmr1 KO mice exhibit altered voltage-dependent eIPSC conductance in L2/3 pyramidal neurons during auditory cortex development. (A,B) Representative example of (A) GABAAR I-V plot and (B) traces of eIPSC gramicidin-perforated patch recordings from P9 WT and KO mice. EGABA is estimated from linear fit from I-V plot. (C) Group data of EGABA from I-V plots across all Fmr1 WT and KO mice and ages. (D–G) Averaged GABAAR I-V plots across ages for WT and KO mice to evaluate developmental regulation of GABAAR responses. Currents for each cell were normalized to the eIPSC peak amplitude of the first holding potential. P9–10: n = 13 cells/5 WT mice and 15 cells/6 KO mice. P12–13: n = 15 cells/5 WT mice and 17 cells/6 KO mice. P15–16: 13 cells/5 WT mice and 14 cells/6 KO mice. P21–25: n = 16 cells/6 WT mice and 14 cells/5 KO mice. *P < 0.05, ****P < 0.0001.
