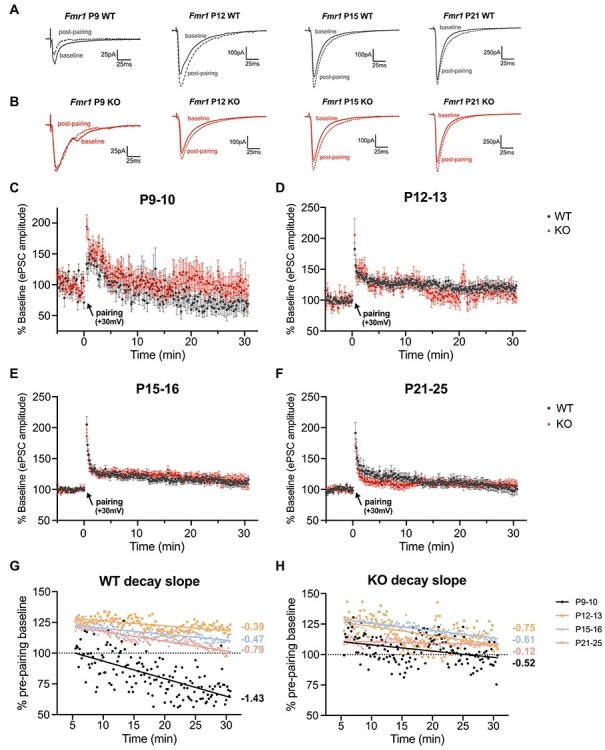
Figure 8 .

Fmr1 KO mice exhibit an altered progression of L4-L2/3 synaptic plasticity during auditory cortex maturation. (A–D) Top: Representative ePSC traces from L2/3 pyramidal neurons with averaged recordings from baseline (prepairing) and averaged recordings from 15 min postpairing from the auditory cortex of WT and Fmr1 KO mice across development. Bottom: Time course of normalized ePSC amplitude changes in LTP experiments. (A) P9–10 mice fail to exhibit LTP in the L4-L2/3 circuit. (B–D) LTP is capable of being induced from P12–25. (E,F) Overlay of the averaged decay data (6–30 min postpairing) by genotype. In WT mice, LTP does not occur until P12, whereby enhancement is attenuated with age (decay slopes increase). Fmr1 KO mice exhibit an altered pattern of LTP synaptic plasticity with increased variability. P9–10: n = 9 cells/7 WT mice and 10 cells/7 KO mice. P12–13: n = 12 cells/7 WT mice and 11 cells/7 KO mice. P15–16: n = 11 cells/8 WT mice and 10 cells/6 KO mice. P21–25: n = 10 cells/7 WT mice and 9 cells/7 KO mice.
