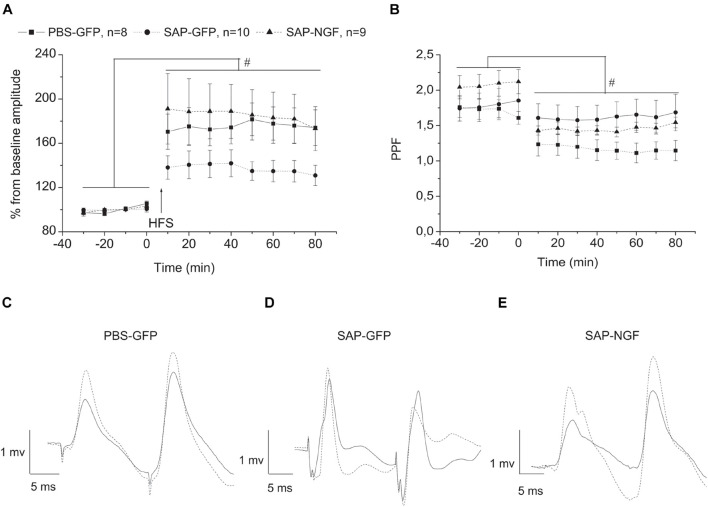
FIGURE 5.
(A) Shows that cholinergic deficit induced by 192IgG-saporin significantly suppressed LTP induction in VHC-CA1 pathway [SAP-GFP (n = 10) and PBS-GFP groups (n = 8)]. NGF overexpression (SAP-NGF group, n = 9) facilitates the induction of hippocampal LTP as compared with SAP-GFP group. In (B), the time course of PPF in PBS-GFP, SAP-GFP, and SAP-NGF groups. In (C–E), dotted lines illustrate the fEPSP after HFS and solid lines, before HFS. Each point represents the mean ± SEM. Percentage of basal fEPSP amplitude at 0 min; #significant differences against the baseline, p < 0.05.

