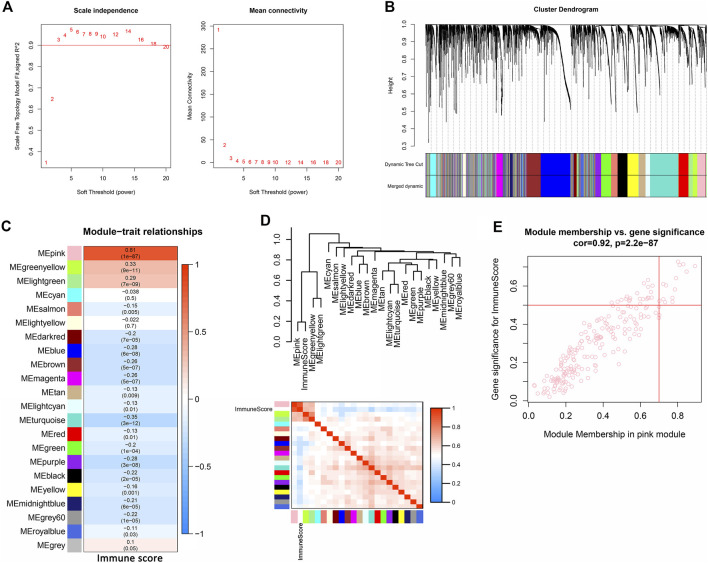
FIGURE 1.
Identification of immune-related module and key genes of OV. (A) Graphs of scale independence, mean connectivity and scale-free topology, the appropriate soft-power was 3. (B) Cluster dendrogram of the co-expression network modules (1-TOM) (C) Analysis of correlations between the modules and immune scores, p-values are shown. (D) Cluster plot analysis of the relationship between immune scores and modules. (E) Scatter plot analysis of the pink module. Key genes were screened out in the upper-right area where GS >0.5 and MM >0.7 (TOM, topological overlap matrix. GS, gene significance. MM, module membership).

