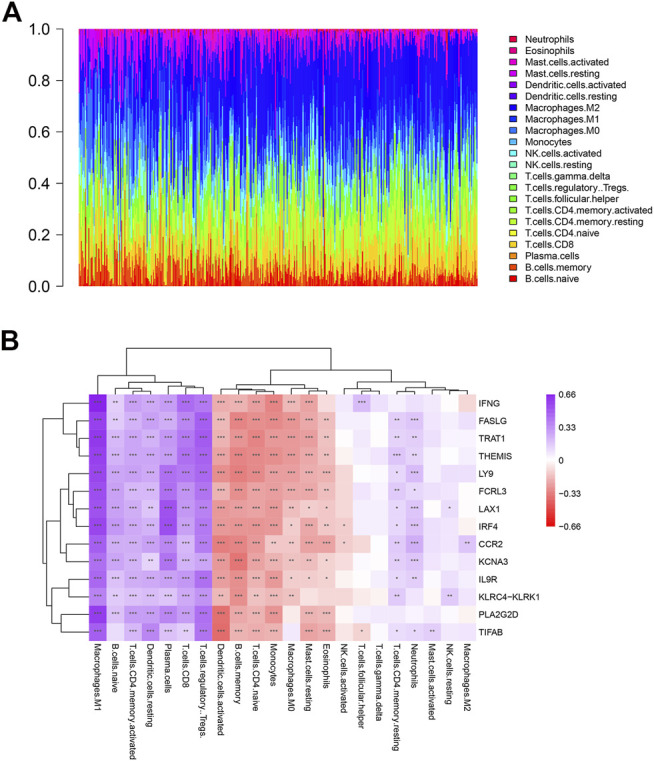
FIGURE 6.

Profile of immune cells in OV and correlation analysis between genes and immune cells. (A) The proportion of 22 kinds of immune cells in ovarian tumor samples. (B) Correlation analysis between the expression of key genes and immune cells abundance.
