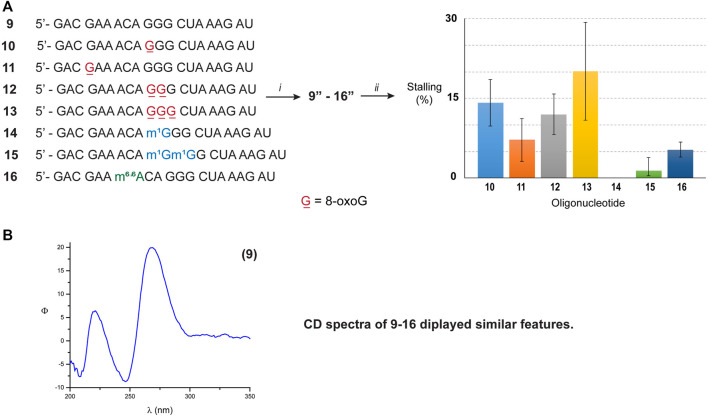
FIGURE 3.
(A) Sequence of ONs 9–16. The graph shows the measured intensity for the bands associated with exonuclease stalling. (i) T4-RNA ligase, bisphosphate 21; then T4-PNK, ATP; (ii) xrn-1, then PAGE. (B) The CD spectrum corresponding to ON 9 was obtained using the following solution composition: (4 μM RNA, 100 mM NaCl, 5 mM MgCl2, 10 mM sodium phosphate, pH 7.5).

