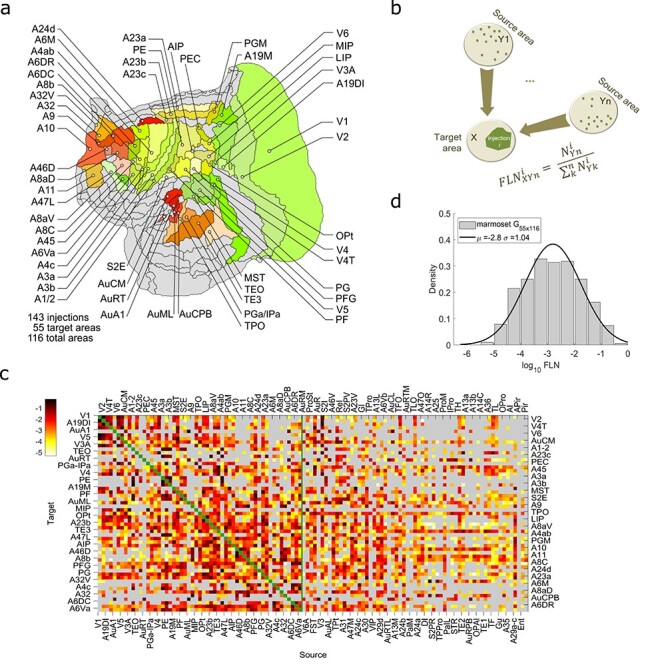
Figure 1 .

Cortico-cortical connectivity weights. (a) The analysis is focused on 55 cortical areas highlighted in different colors on the 2-dimensional flattened map of the marmoset cortex. The gray shaded areas are those for which no tracer injection was available. (b) Schematic description of the FLN found in area  after the retrograde tracer injection
  in the cortical area
  (
( ). (c) The weighted and directed marmoset cortical interareal connectivity matrix. The rows are the 55 target areas and the columns the 116 source areas that provide inputs to the target areas. Each entry in the matrix is the base 10 logarithm of the arithmetic mean of the FLN
  across injections within the same target area. Gray: absence of connections, green, along the diagonal line: presence of intra-area connections (they have not been quantitively measured and the corresponding FLN is set to 0). The vertical green line defines the limit of the edge complete
  subnetwork in which all inputs and outputs are known. (d) The distribution of the connectivity weights, shown in (c), reveals that the connectivity weights are highly heterogenous, they span 5 orders of magnitude, and they are log-normally distributed. Bin size = 0.5 on logarithmic scale. The black line is Gaussian fit to the
  values.
