Figure 2 .

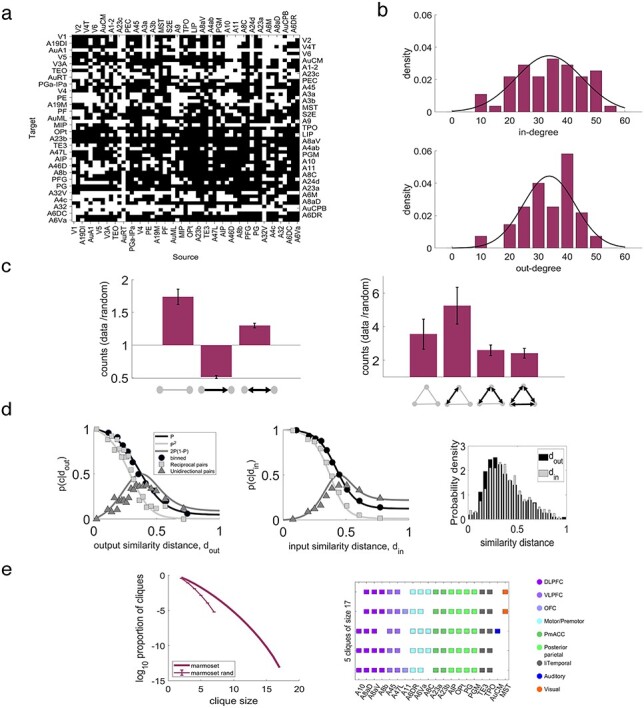
Marmoset network connectivity properties. (a) The edge-complete subnetwork, in which all inputs and outputs are known, shows a dense matrix of topological connections. Black: existence, white: absence of a connection. (b) In- (top) and out- (bottom) degree distribution of the target areas. Gray lines are Gaussian fits to the data. (c) Average fraction of 2- (left) and 3- (right) node motif counts of the edge-complete subnetwork to the 2- and 3-node motif counts, respectively, of a randomized version of the edge-complete network keeping the in- and out-degree the same across 100 realizations. Error bars are one standard deviation of these fractions. (d) Proportion of connection as a function of the output (left) and input (middle) similarity distance. Black circles are the number of present connections divided by the number of possible connections in the distance bin. Black line is maximum likelihood fit on the unbinned data. Light gray line is prediction for the reciprocal pairs from the fitted black plot and light gray squares are the proportions of reciprocal pairs in the given bin. Dark gray line is the prediction for the unidirectional pairs and dark gray triangles are the proportions of unidirectional pairs in the given bin. Right: Distribution of the output (black) and input (gray) similarity distances. (e) Left: Base 10 logarithm of the proportion of cliques as function of the clique size in the data and the average proportion of cliques in 1000 realizations of a random network of same size where the in- and out- degree sequences are the same as in the data (error bars are one standard deviation). Right: 5 cliques of size 17, combinedly formed by 20 areas that constitute the core of the marmoset cortical connectome.
