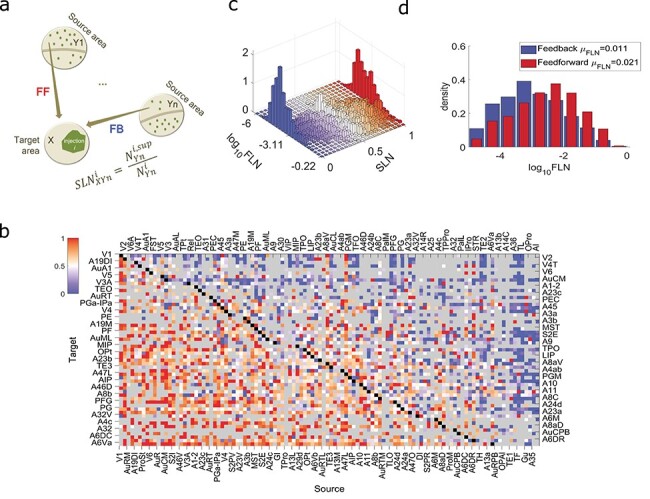
Figure 3 .

Structural hierarchy. (a) Schematic description of the computation of the supragranular labeled neurons found in area  after the retrograde tracer injection
  in the cortical area
  (
( ). Projections with
  (red entries in (b)) are considered as FF projections and those with
  are FB projections (blue entries in (b)). (b) The SLN matrix. The rows are the 55 target areas and the columns the 112 source areas that provide inputs to each target area, ordered according to the computed hierarchy (Fig. 4a, Supplementary Fig. 2b, right). Each entry in the matrix is the weighted mean supragranular labeled neurons across injections within the same target area. Gray: absence of connections, black: presence of recurrent connections. (c) Two-dimensional distribution of the FLN and SLN values. The distribution of SLN is not dependent on the strength of connections, except, as expected, at the edges of the distribution formed by very few labeled neurons. (d) Distribution of the FLN values of the FF connections (red;
  ) and of the FB connections (blue;
  , with the first being stronger than the latter (higher mean; the 2 distributions are different (2-sided 2-sample Kolmogorov–Smirnov test:
  , Hedges’ g effect size:
  ), with different mean (2-sided 2-sample t-test:
  ) but same variance (2-sided 2-sample F-test:
  ).
).
