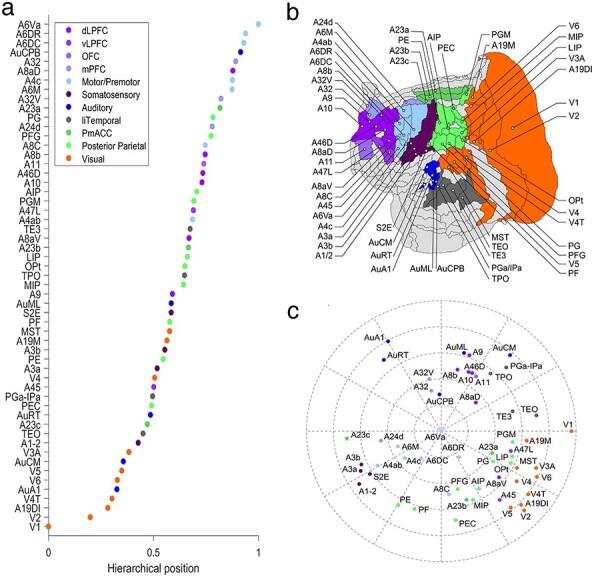
Figure 4 .

Hierarchical structure. (a) Hierarchy of the edge-complete network. (b) Flat map of the marmoset cortex, where the color of the shaded areas follows the same coloring scheme as in (a). (c) Two-dimensional representation of the connectivity strength between areas. The radial direction (distance from the outer edge) is defined by the hierarchical position, and the angular distance is given by the inverse of the strength of the connection. It reveals that functionally related areas are grouped together, sensory areas form parallel streams of processing, and different association areas are related to different sensory modalities.
