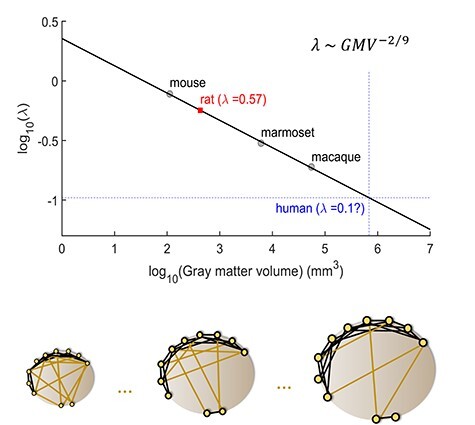
Figure 7 .

Cortical-connectivity spatial length as a function of brain size: extrapolation to humans. Top: The base 10 logarithm of the decay rate of the EDR (λ) of the mouse, marmoset, and macaque, computed in the same way in all 3 cases. The plot is a linear fit on these 3 points with a slope of 
 . The red square is the predicted value of the decay rate of the EDR of the rat which is validated by indirect methods (Noori et al. 2017) of computing it, and the intersection of the blue dotted lines is the extrapolation of the decay rate of spatial dependence of cortico-cortical connectivity in the human species. Bottom: A schematic representation of the decrease of long-range connections as the gray matter gets bigger, showing that the bigger the brain the more local the connectivity.
