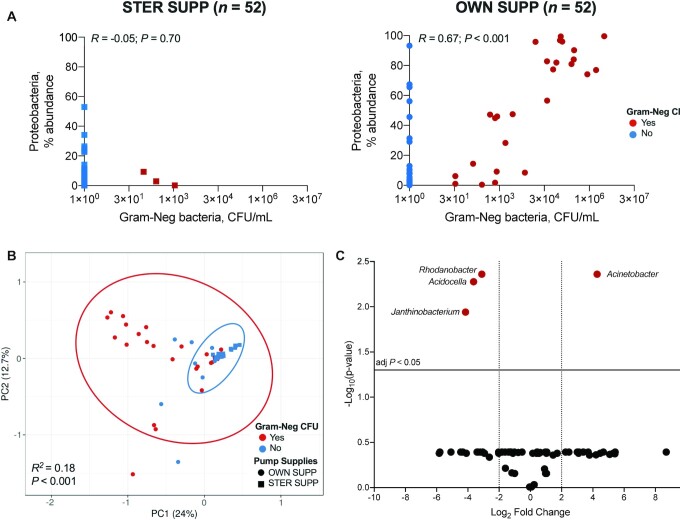
FIGURE 4.
Correlations between culturable gram-negative bacteria and 16S microbiome. (A) There was no Spearman correlation between Gram-Neg bacterial counts and percent relative abundances of Proteobacteria 16S in STER SUPP (P = 0.7) but a strong correlation for OWN SUPP (P < 0.001). (B) PCA ordination of Proteobacteria 16S sequences; samples with culturable Gram-Neg bacteria had a different 16S community than samples without culturable Gram-Neg bacteria (permutational ANOVA P < 0.001). (C) The volcano plot shows the log2 fold change (x-axis) of Proteobacteria asegenera that differed significantly (FDR-adjusted P value y-axis) between samples yielding culturable gram-negative bacteria and those that did not, regardless of pumping supplies used for collection. FDR, false discovery rate; Gram-Neg, gram-negative bacteria; OWN SUPP, personal electric breast pump and milk collection kits; PCA, Principal component analysis; PC1, Principal component 1; PC2, Principal component 2; STER SUPP, hospital-grade pump and new, sterile collection kits.

