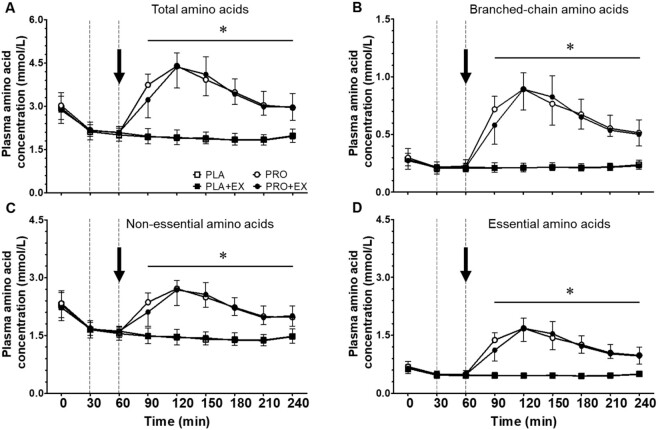
FIGURE 2.
Plasma (A) total, (B) branched-chain, (C) nonessential, and (D) essential amino acid concentrations throughout hemodialysis at rest and following exercise with and without protein ingestion. The dotted lines represent the start and end of intradialytic exercise, and the arrow represents the ingestion of the test beverage. Values are expressed as means ± SDs, n = 10 for all values. Data were analyzed with a 3-factor repeated-measures ANOVA with time, protein ingestion (yes/no), and exercise (yes/no) as within-subject variables, and separate analysis was performed when a significant interaction was detected. Time × protein interaction P < 0.05. *Protein interventions significantly different from placebo interventions (protein effect P ≤ 0.001). PLA, placebo; PLA + EX, placebo and exercise; PRO, protein; PRO + EX, protein and exercise.

