
FIGURE 3.
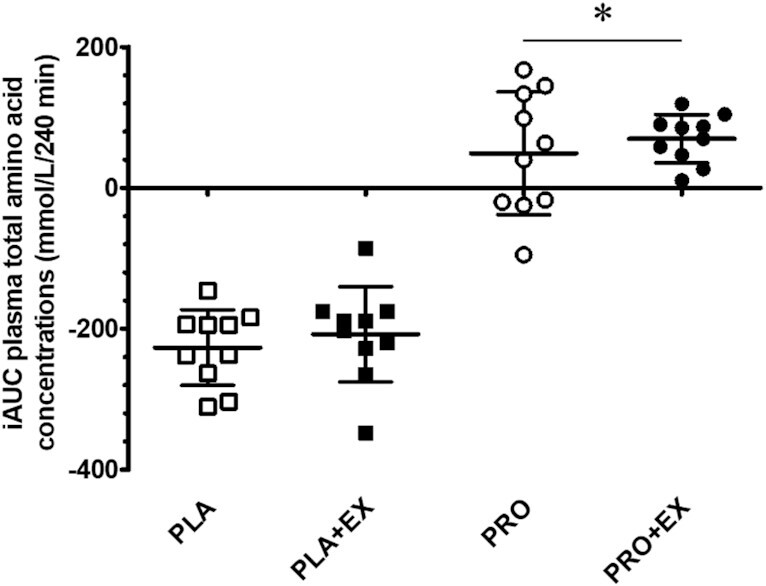
Incremental AUC of plasma total amino acid concentrations throughout hemodialysis at rest and following exercise with and without protein ingestion. The incremental AUC was calculated over the 240-min hemodialysis period. Squares and circles represent individual data points, and bars represent group means ± SDs, n = 10. Data were analyzed with a 2-factor repeated-measures ANOVA with protein ingestion (yes/no) and exercise (yes/no) as within-subject variables. *Significantly different from placebo interventions (protein effect P < 0.001). iAUC, incremental AUC; PLA, placebo; PLA + EX, placebo and exercise; PRO, protein; PRO + EX, protein and exercise.