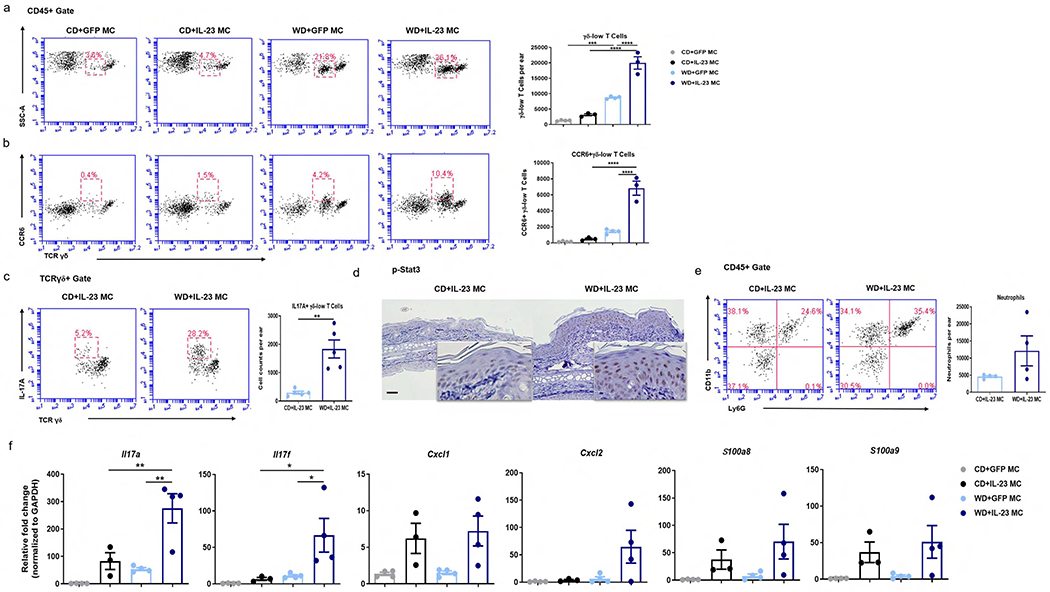
Figure 2. WD intake promotes IL-23-mediated skin inflammation accompanied by infiltration of γδ T cells and an enhanced Th17 response.

(a, b) Representative flow cytometry plots and absolute numbers of total (a) and CCR6-positive γδ-low T cells (b) in ear skin from mice with indicated treatment. (c) Representative flow cytometry plots and absolute numbers of IL-17A-producing γδ-low T cells, (d) representative images of immunohistochemical staining of p-stat3 (scale bars, 50 μm), (e) representative flow cytometry plots and absolute numbers of neutrophils in ear skin from CD-fed and WD-fed after IL-23 MC delivery. (f) Gene expression of psoriasis-related cytokines in ear skin from mice with indicated treatment. All of the data are presented as mean ± SEM. 3-4 mice per group. Data are representative of two independent experiments. * p <0.05, ** p <0.01. *** p <0.001, **** p <0.0001, by using one-way ANOVA with Bonferroni’s test in (a, b, f) and Student’s t-test in (c, e).
