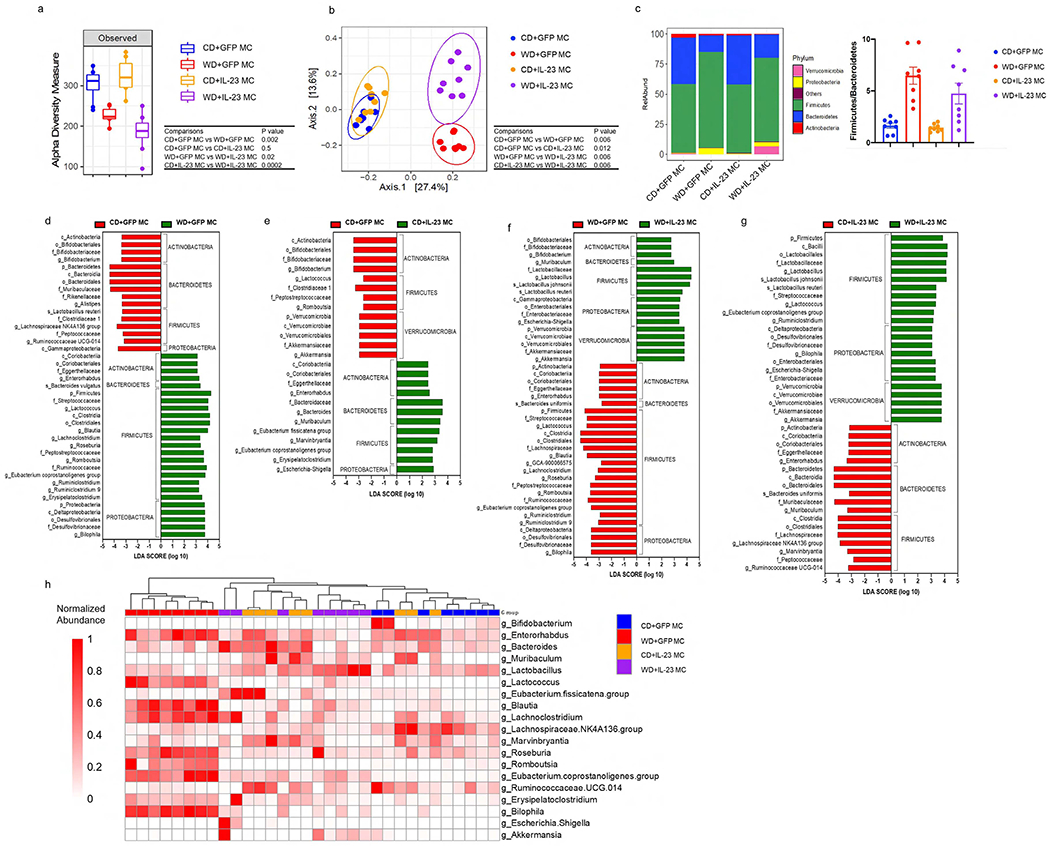
Figure 4. Diet and over-expression of IL-23 influence gut microbiota in a synergistic manner.

(a) Observed index of bacterial diversity, (b) PCoA of UniFrac distances, (c) bacterial classification at the phylum level and (d-g) LEfSe analysis showing significant differences in bacterial abundance between indicated groups. The threshold of logarithmic LDA score was 2. (h) Heatmap showing the most discriminative genus among the groups. n = 8 per group. The significance was assessed by Mann–Whitney U test in (a) and by Paired-Permanova test with Bonferroni correction in (b).
