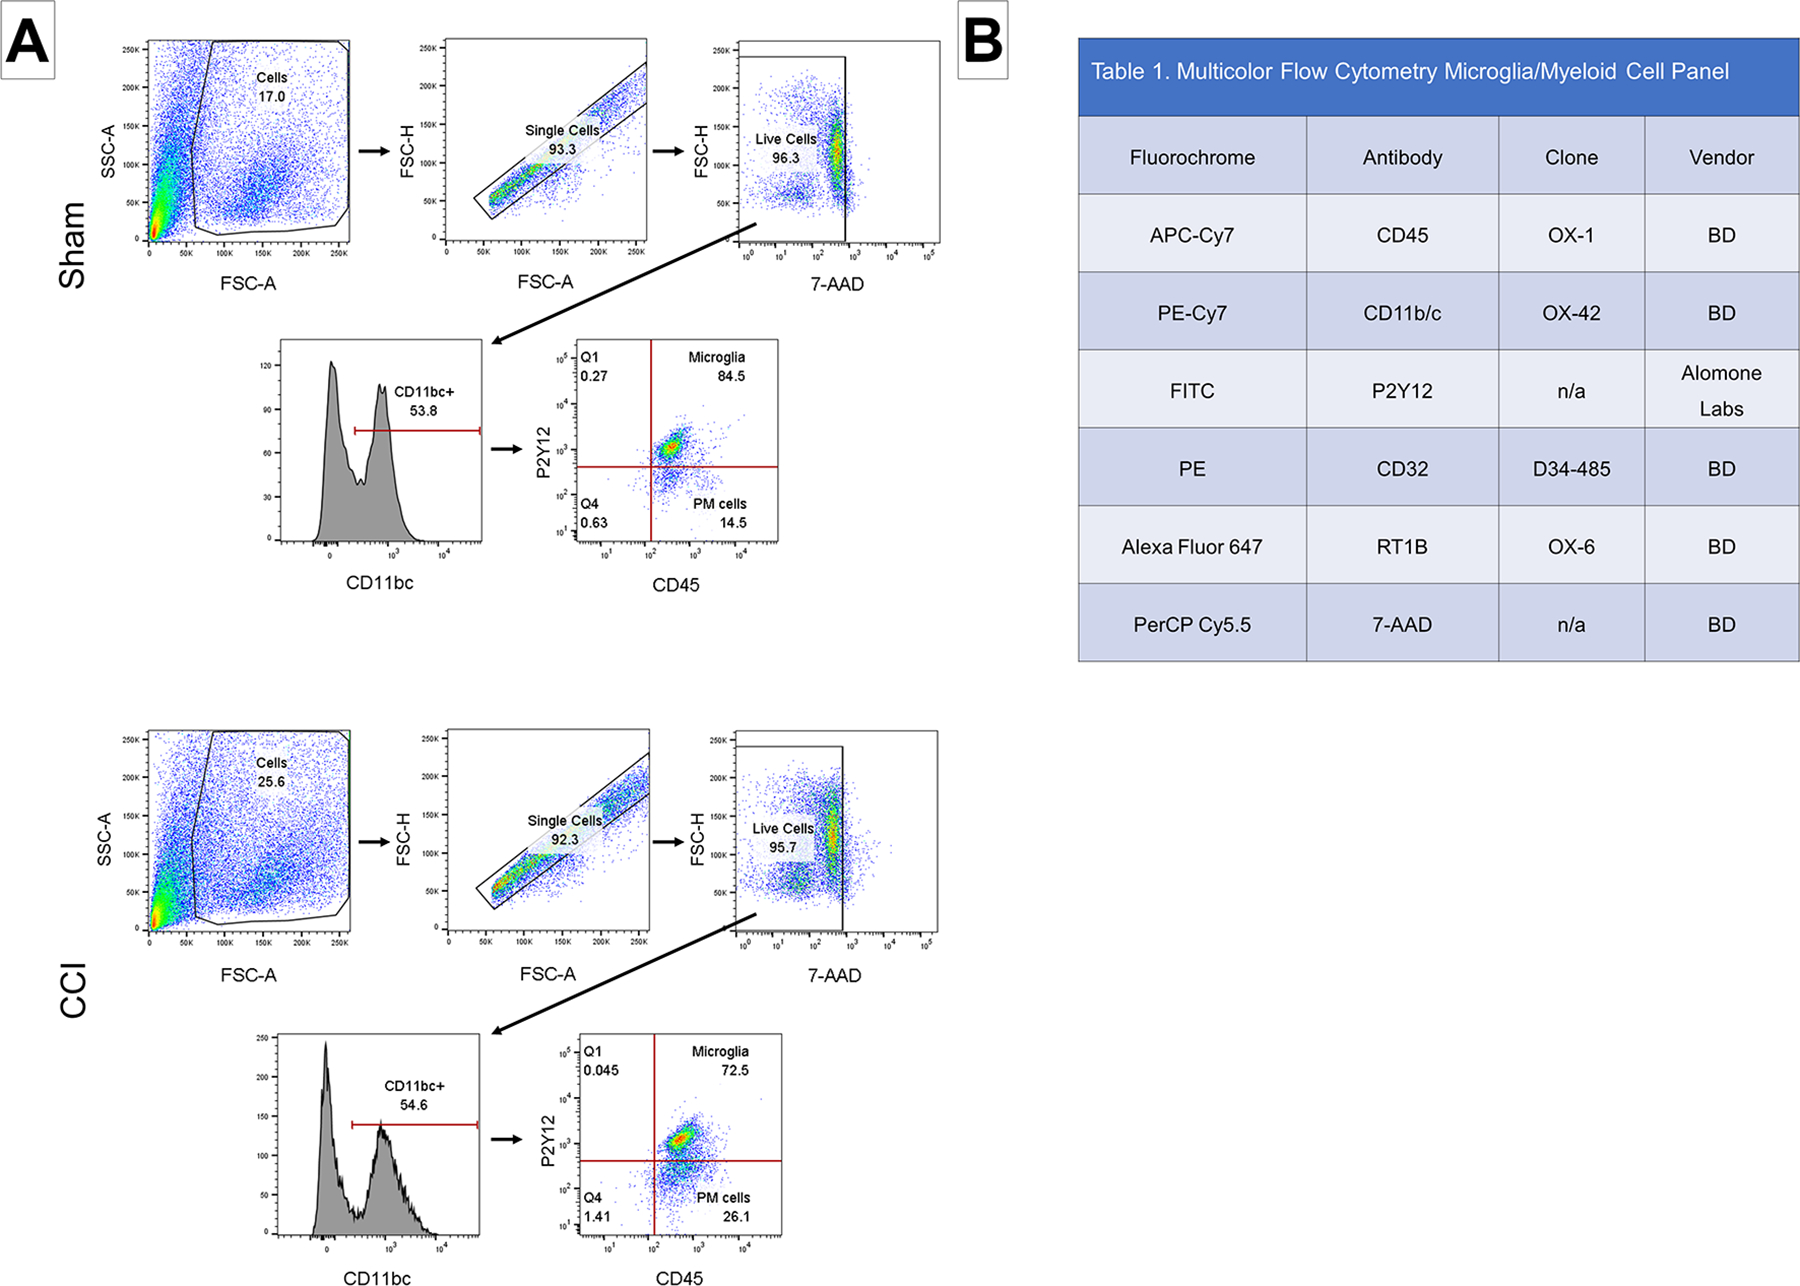
Figure 2. Microglia gating strategy and multicolor flow cytometry panel.

(A): Representative samples from both sham and CCI groups are shown. The single cell population was identified based on SSC and FSC. Live cells were identified as negative for the 7-AAD. Microglia were identified using a two-step method. First, CD11b/c+ cells (PE-Cy7) were selected to identify all myeloid cells. The CD11b/c+ cells were then gated on P2Y12 (FITC) and CD45 (APC-Cy7). Microglia were identified as triple positive cells. SSC, side scatter; FSC, forward scatter. (B): The multiple color flow cytometry panel used to identify and immunophenotype microglia and peripheral myeloid cells.
