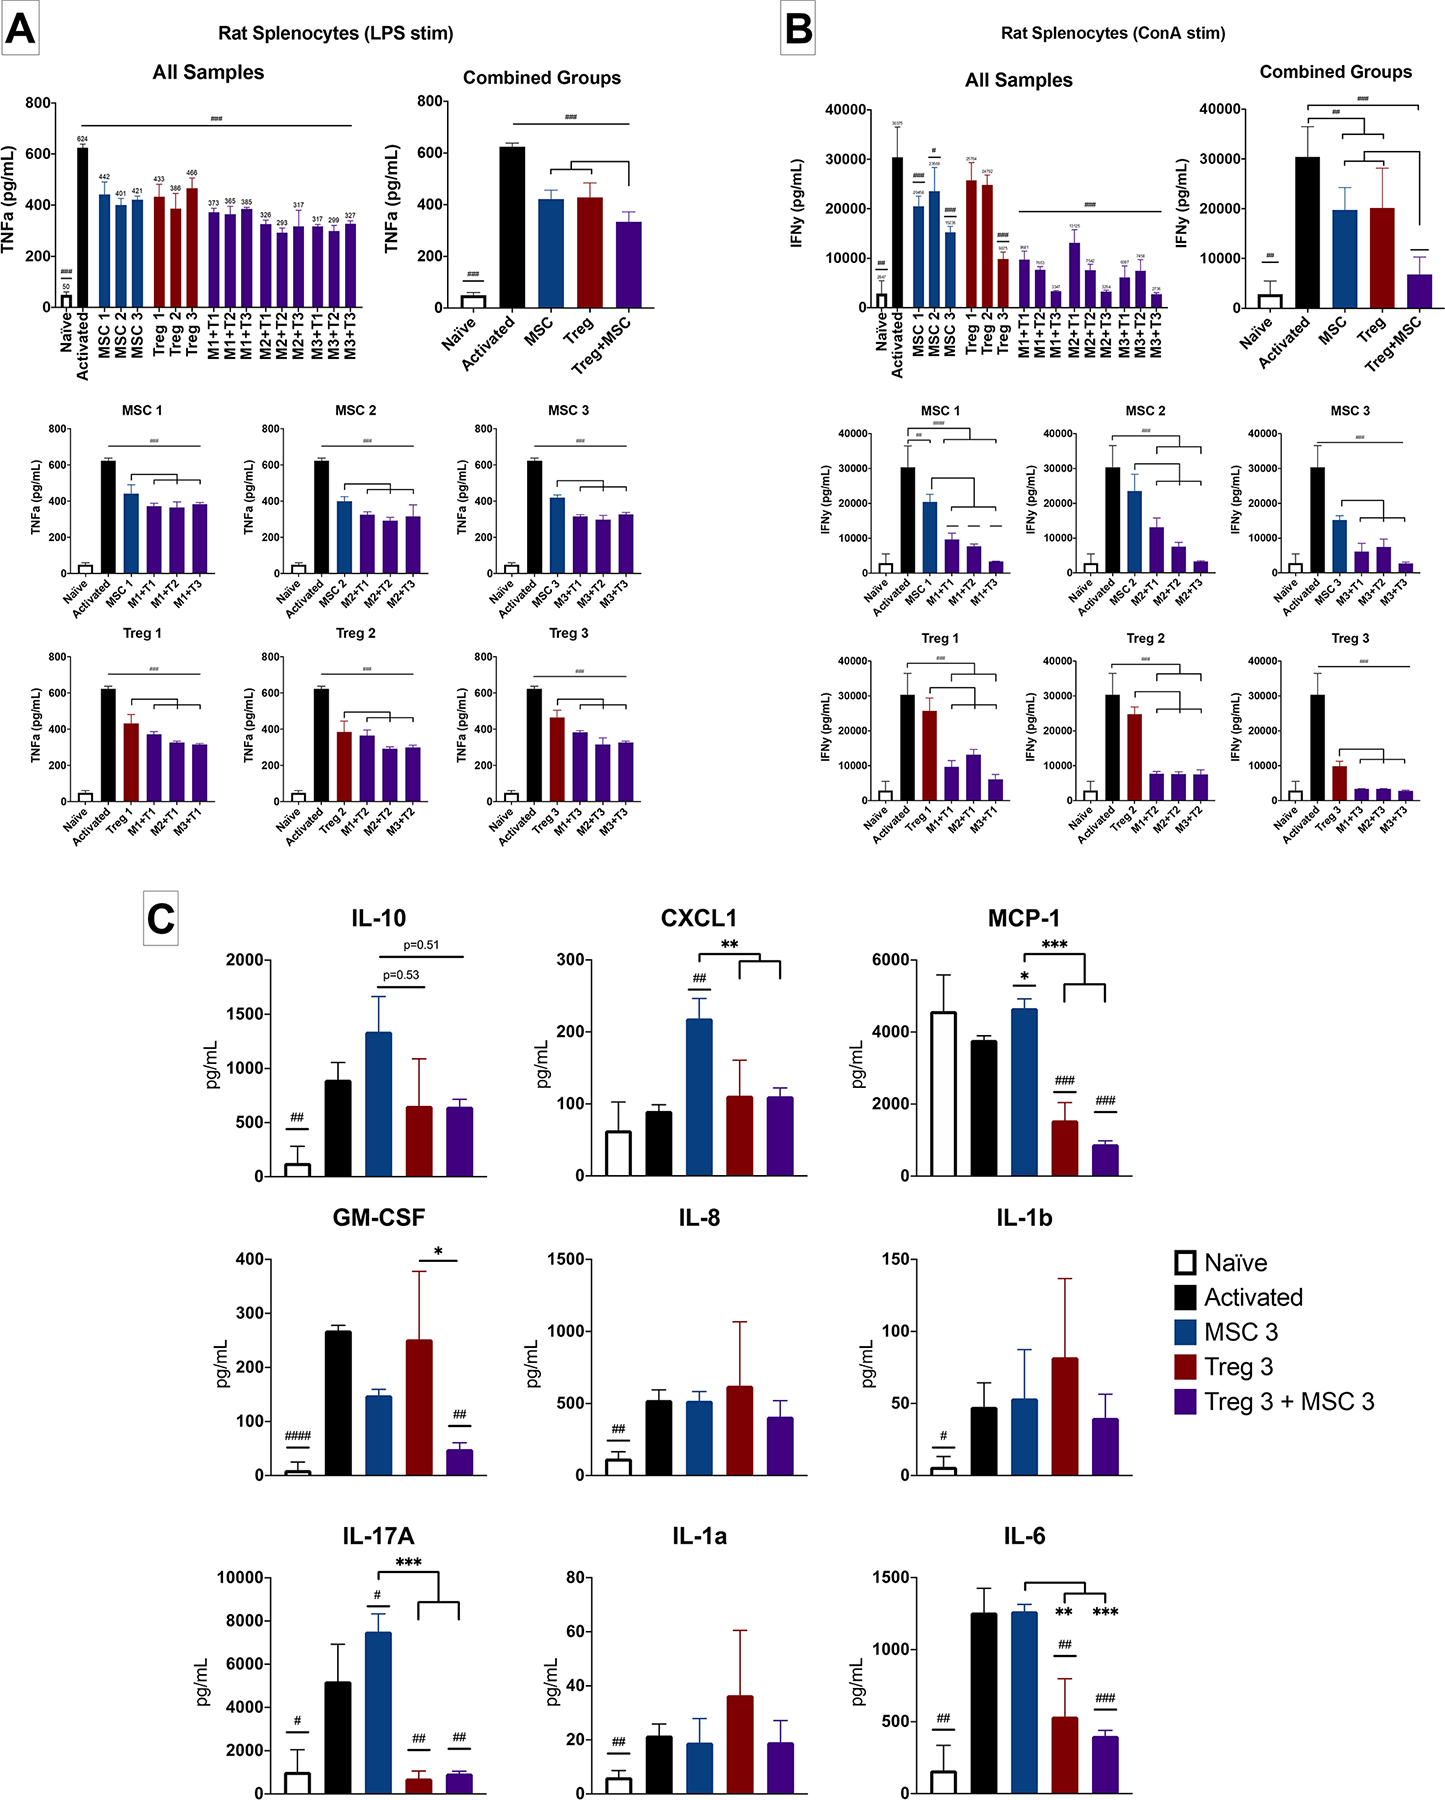
Figure 3. Characterization of Treg, MSC and Treg+MSC combination therapy potency using activated rat splenocytes in vitro.

(A): TNFα production (ELISA) by rat splenocytes after LPS stimulation (Treg Donors 1–3, MSC Donors 1–3). (B): IFNγ production (ELISA) by rat splenocytes after ConA stimulation (Treg Donors 1–3, MSC Donors 1–3). (C): Assessment of multiple chemokines/cytokine production (LEGENDplex) by activated rat splenocytes (Treg Donor 3, MSC Donor 3). All samples run in triplicate. Statistical significance between naive/treatment and activated control is indicated with (#) for p ≤ 0.05, (##) for p ≤ 0.01, (###) for p ≤ 0.001. Statistical significance between treatment groups is indicated with (*) for p ≤ 0.05, (**) for p ≤ 0.01, (***) for p ≤ 0.001. Treg, regulatory T cell; MSC, mesenchymal stromal cell; TNFα, tumor necrosis factor alpha; IFNγ, interferon gamma; ELISA, enzyme-linked immunosorbent assay.
