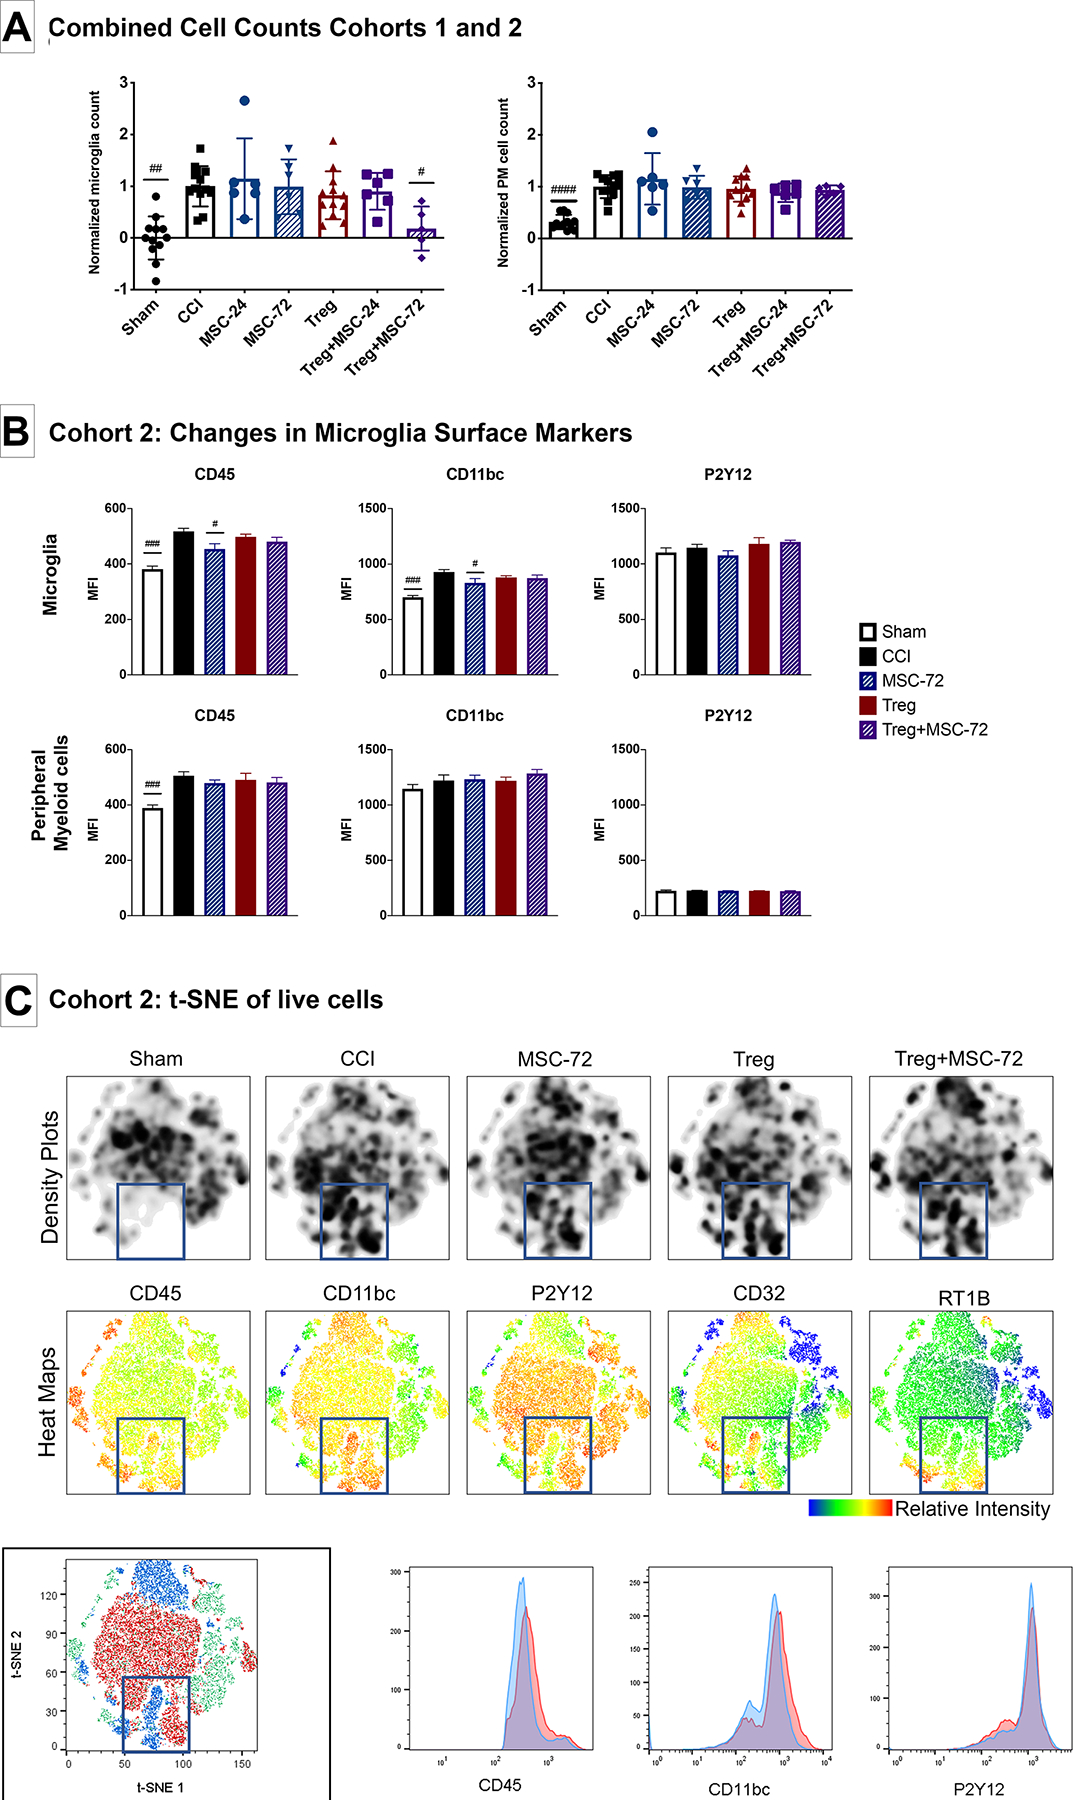
Figure 5: Flow cytometry characterization of changes in microglia and peripheral myeloid cells populations after injury and treatment.

(A-B): Assessment of microglia activation using conventional flow cytometry logic gating analysis. (A): Combined absolute microglia (left) and PM (right) cell counts from Cohorts 1 and 2, normalized to CCI. (B): Changes in microglia and PM flow cytometry surface marker expression in Cohort 2. (C): t-SNE visualization of changes in microglia and PM cell populations after injury and treatment. Density plots (top row) demonstrate changes in cell populations between sham and CCI. Analysis of antibody heat maps (middle row), cell clusters and antibody histograms (bottom row) demonstrate that there are increases in both microglia and PM cell populations and markers of activation in the injured brain at 14 days after injury. No substantial differences between the injured control and treatments groups are appreciated. Statistical significance between sham/treatment and CCI is indicated with (#) for p ≤ 0.05, (##) for p ≤ 0.01, (###) for p ≤ 0.001. Statistical significance between treatment groups is indicated with (*) for p ≤ 0.05, (**) for p ≤ 0.01, (***) for p ≤ 0.001. PM, peripheral myeloid cell; CCI, controlled cortical impact; t-SNE, t-distributed stochastic neighbor embedding.
