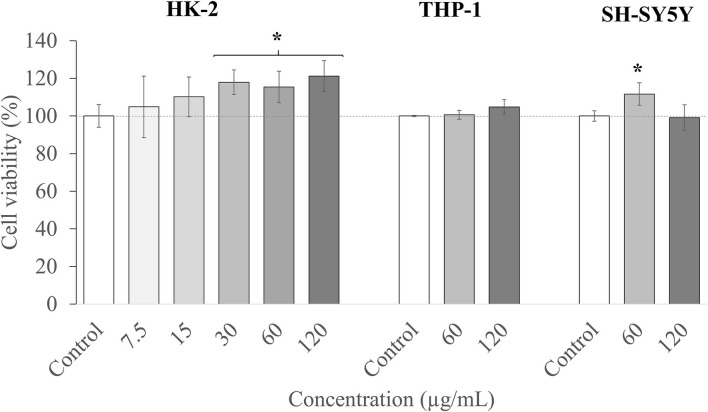
Figure 5.
Cell viability in human kidney-2 (HK-2), THP-1, and SH-S5Y5 cell lines upon treatment for 24 h with different concentrations of T33 extract. Error bars are given as the SD of three independent experiments. (*) indicates significant differences between the treated and control samples, p < 0.05.

