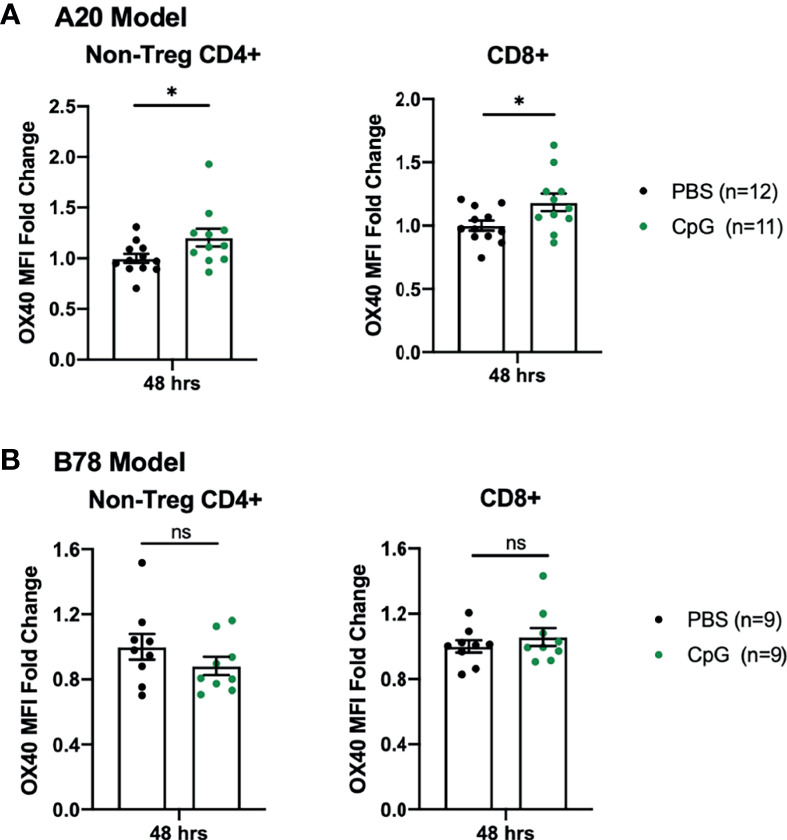
Figure 2.

B78 and A20 Tumor Models Demonstrate Differences in Response to CpG Treatment. (A) OX40 MFI fold change expression on non-Treg CD4+ or CD8+ tumor infiltrating T cells in the A20 model 48 hours after treatment with PBS (black) or CpG (green). (B) OX40 MFI fold change expression on non-Treg CD4+ or CD8+ tumor infiltrating T cells in the B78 model 48 hours after treatment with PBS (black) or CpG (green). The data plotted here are the results from two independent experiments (n=4-6 per group, per experiment). Average OX40 MFI values in the PBS cohort were calculated for each separate experiment, then used to determine fold-change differences for each sample from that particular experiment. Each symbol represents the MFI fold change from one mouse. Flow gating strategy is presented in Supplementary Figure 3. P values were calculated using Mann-Whitney tests. *P ≤ 0.05; NS, nonsignificant.
