. 2021 Aug 3;12(36):11955–11964. doi: 10.1039/d1sc01914g

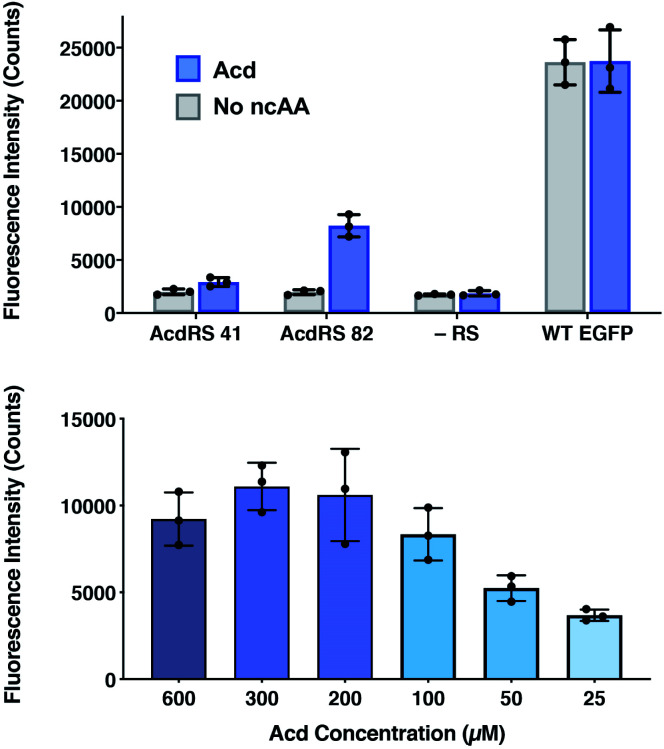
Fig. 4. Lysate fluorescence analysis of Acd incorporation in mammalian cells. Top: fluorescence measured from EGFP-Y40δ HEK cell lysates after 36 h using Mb AcdRS 41 or 82 with 300 μM Acd or no ncAA added. As a negative control, the EGFP plasmid was transfected without the AcdRS and tRNACUA plasmid (−aaRS). WT EGFP was separately transfected as a positive control. In all conditions, DN-eRF1 was also transfected. n = 3. Protocols are described in detail the ESI comparison of AcdRS incorporation efficiency section. Cell images are shown in ESI, Fig. S21. Bottom: expression of EGFP-Y40δ using Mb AcdRS 82 was performed as above, with varying concentrations of Acd. n = 3. Protocols are described in the ESI optimizing expression conditions section. Cell images are shown in ESI, Fig. S3..

Fig. 4