. 2021 Aug 3;12(36):11955–11964. doi: 10.1039/d1sc01914g

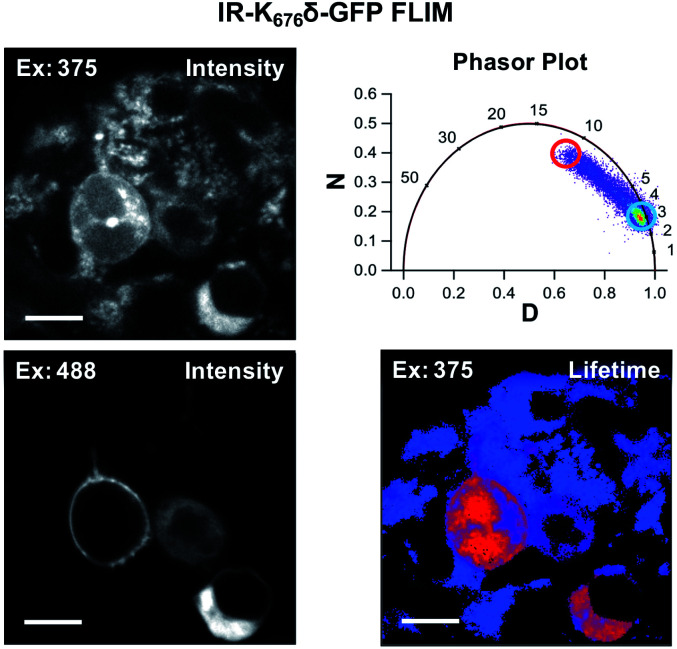
Fig. 6. Acd fluorescence lifetime imaging (FLIM). FLIM allows Acd fluorescence to be separated from autofluorescence in living cells. IR-K676δ-GFP was expressed with Mb AcdRS 82 in HEK cells. Intensity plots (left) show emission after excitation at 375 or 488 nm. Phasor plot (top right) shows phase vectors D and N (see ESI for details) plotted for excitation at 375 nM with 10 MHz modulation and points representing lifetimes of pixels. Circles indicate pixels with a large fraction of lifetime ≥15 ns (red) and pixels with a large fraction of lifetimes <4 ns (blue) in the lifetime image (bottom right). Scale bar = 20 μm. Transfection and imaging conditions are described in the ESI confocal microscopy and FLIM section.

Fig. 6