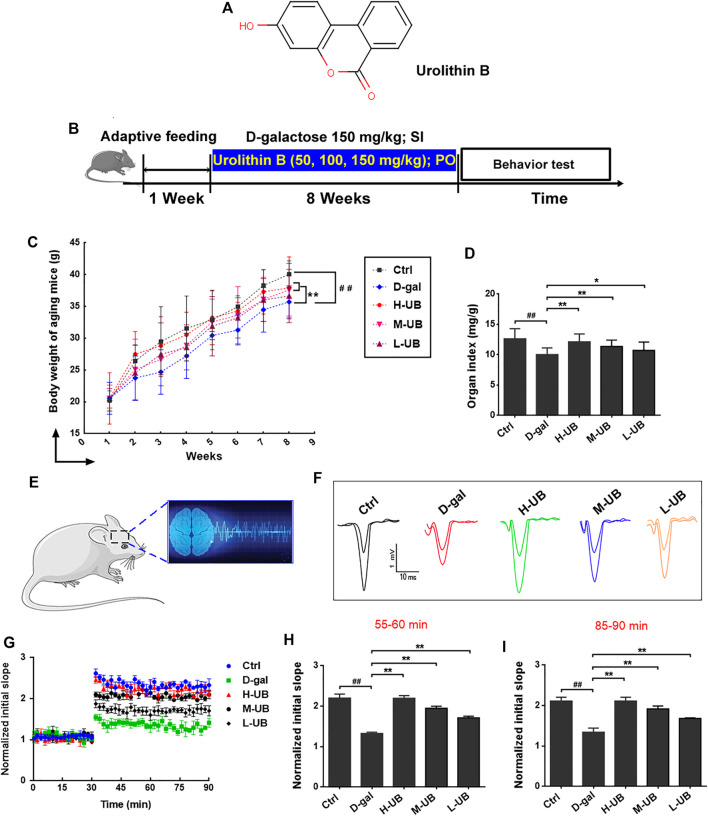
FIGURE 2.
(A) Molecular structure of UB. (B) Schematic diagram of the experimental design for the D-gal-induced aging model and UB treatment. (C) Effect of UB on body weight (C) and brain index (D) in all groups (n = 12 per group). (E) A graphical drawing showing electrophysiological recordings. (F) Representative fEPSP traces. (G) The slope of the fEPSP was measured for 90 min. The data represent averaged increases in the slope of the fEPSP at t = 55–60 (H) and 85–90 (I) min relative to baseline (n = 6 per group). All results are described as means ± SD. # p < 0.05 and ## p < 0.01 vs the control group; * p < 0.05 and ** p < 0.01 vs the D-gal-induced aging group. SI: Subcutaneous Injection; PO: Per Oral.

