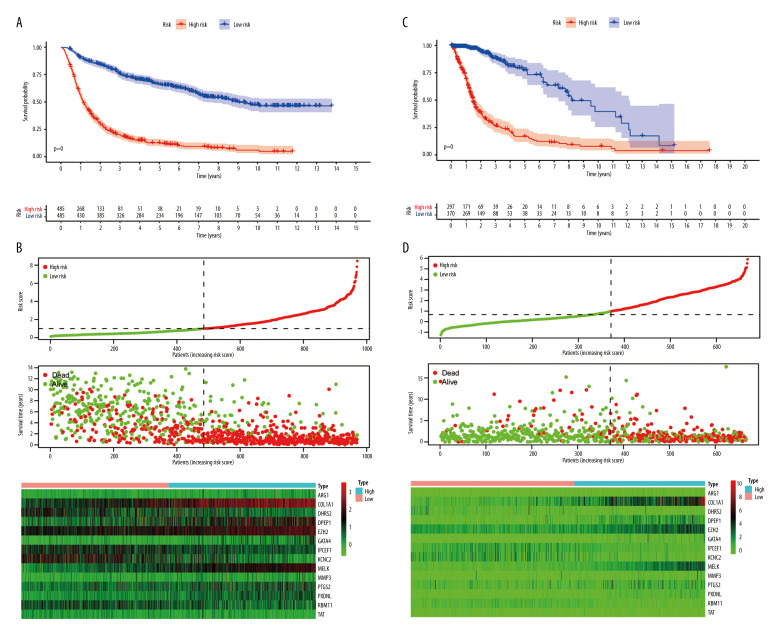
Figure 4.
Risk score model construction and external validation. (A) Kaplan-Meier survival curves for overall survival (OS) in the Chinese Glioma Genome Atlas (CGGA) cohort. (B) Risk score, survival status of patients, and heat map of the expression profile for the oxidative stress-related genes (OSRGs) in the CGGA cohort. (C) Kaplan-Meier survival curves for OS in The Cancer Genome Atlas (TCGA) cohort. (D) Risk score, survival status of patients and heat map of the expression profile for the OSRGs in TCGA cohort. (R Studio, Version 1.2.5042, RStudio, Inc.).

